
A Shiny app for inferential statistics by hand
A Shiny app for inferential statistics: hypothesis tests and confidence intervals
Statistics is divided into four main branches:
- Descriptive statistics
- Inferential statistics
- Predictive analysis
- Exploratory analysis
Descriptive statistics provide a summary of the data; it helps explaining the data in a concise way without losing too much information. Data can be summarized numerically or graphically. See descriptive statistics by hand or in R to learn more about this branch of statistics.
The branch of predictive analysis aims at predicting a dependent variable based on one or several independent variables. Depending on the type of data to be predicted, it often encompasses methods such as linear regression or classification.
Exploratory analyses focus on using graphical approaches to delve into the data and identify the relationships that exist between the different variables in the dataset. They are therefore more akin to data visualization.
Inferential statistics uses a random sample of data taken from a population to make inferences, i.e., to draw conclusions about the population (see the difference between population and sample). In other words, information from the sample is used to make generalizations about the parameter of interest in the population.
The two major tools in inferential statistics are:
- confidence intervals, and
- hypothesis tests.
Here is a Shiny app which helps you to use these two tools:
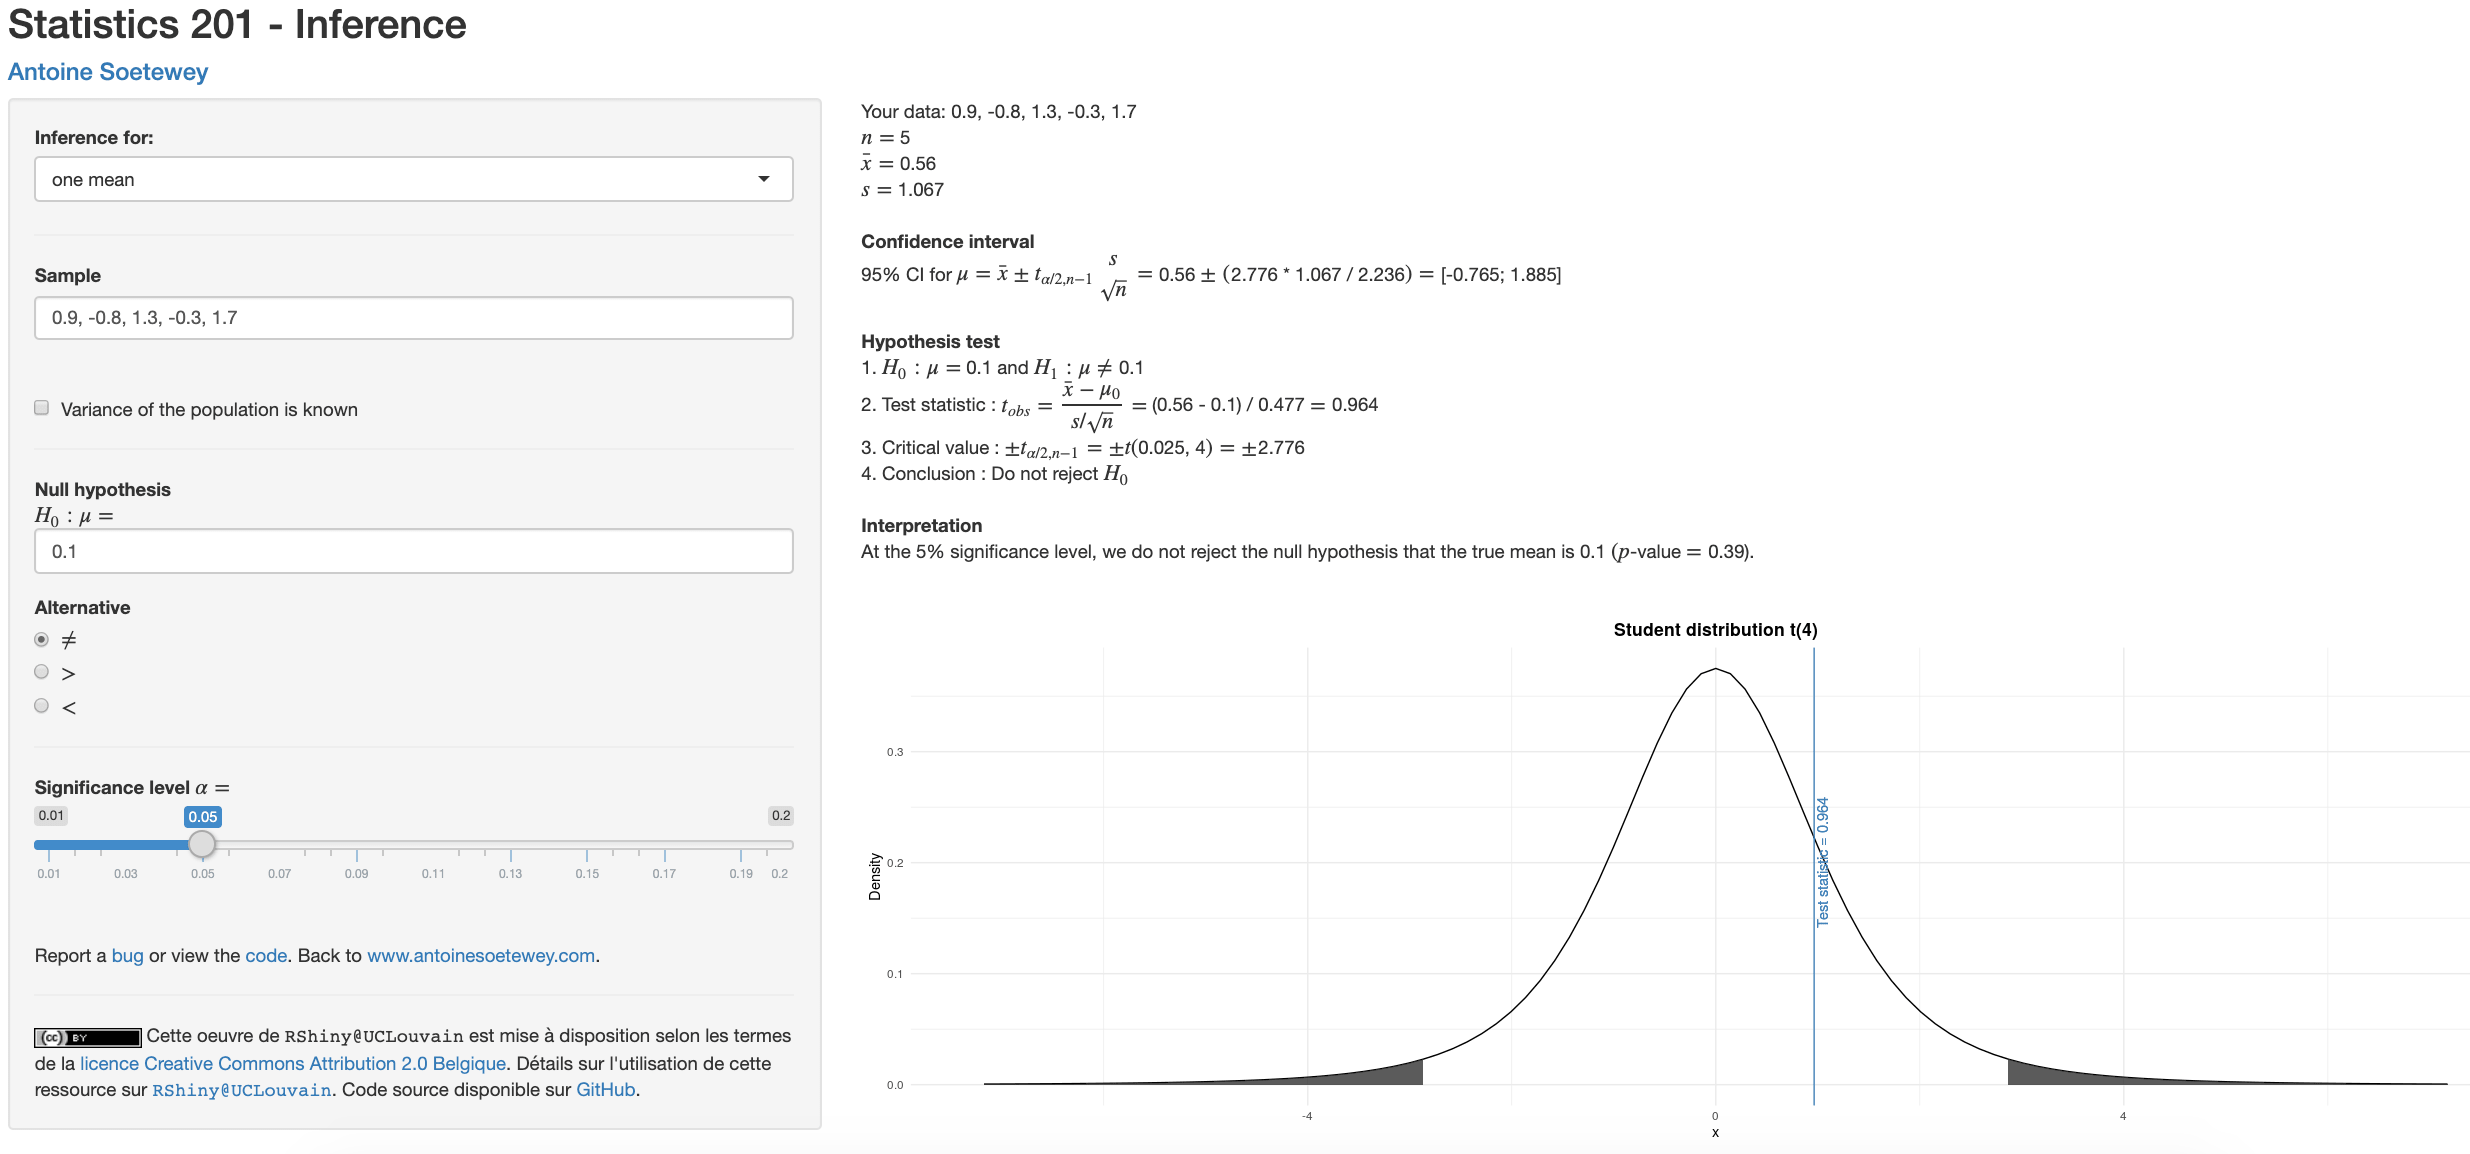
This Shiny app focuses on confidence intervals and hypothesis tests for:
- 1 and 2 means (with unpaired and paired samples)
- 1 and 2 proportions
- 1 and 2 variances
How to use this app?
Follow these steps:
- Open the app via this link
- Choose the parameter(s) you want to do inference for (i.e., mean(s), proportion(s) or variance(s))
- Write your data in Sample. Observations are separated by a comma and the decimal is a point
- Set the null and alternative hypothesis
- Select the significance level (most of the time \(\alpha = 0.05\))
In the results panel (on the right side or below depending on the size of your screen), you will see:
- a recap of your sample together with some appropriate descriptive statistics
- the confidence interval
- the hypothesis test
- the interpretation
- and an illustration of the hypothesis test
All formulas, steps and computations to arrive at the final results are also provided.
Code
Here is the entire code (or see the last version on GitHub) in case you would like to enhance it.
Note that the link may not work if the app has hit the monthly usage limit. Try again later if that is the case.
Conclusion
Thanks for reading.
I hope you will find this app useful to do inferential statistics and in particular confidence interval and hypothesis testing by hand.
If you need to learn more about the structure of a hypothesis test by hand, see this article. See also this flowchart to have an overview of the most common statistical tests.
As always, if you have a question or a suggestion related to the topic covered in this article, please add it as a comment so other readers can benefit from the discussion.
Liked this post?
- Get updates every time a new article is published (no spam and unsubscribe anytime)
- Support the blog
- Share on:


