
COVID-19 in Belgium: is it over yet?
Introduction
Note 1: The present article has been written on May 22, 2020 and has been updated infrequently. The current situation regarding COVID-19 in Belgium may therefore be different to what is presented below. See my Twitter profile for more frequent updates of the plots.
Note 2: This is a joint work with Prof. Niko Speybroeck, Prof. Catherine Linard, Prof. Simon Dellicour and Angel Rosas-Aguirre.
Belgium recently started to lift its lockdown measures initially imposed to contain the spread of the Covid-19. Following this decision taken by Belgian authorities, we analyze how the situation evolved so far.
Contrarily to a previous article in which I analyzed the outbreak of the Coronavirus in Belgium using the SIR model, in this article we focus on the evolution of the number of:
- hospital admissions
- patients in hospitals
- patients in intensive care
- new confirmed cases
at the province and national level.
Data is from Sciensano and all plots were created with the {ggplot2} package.
New hospital admissions
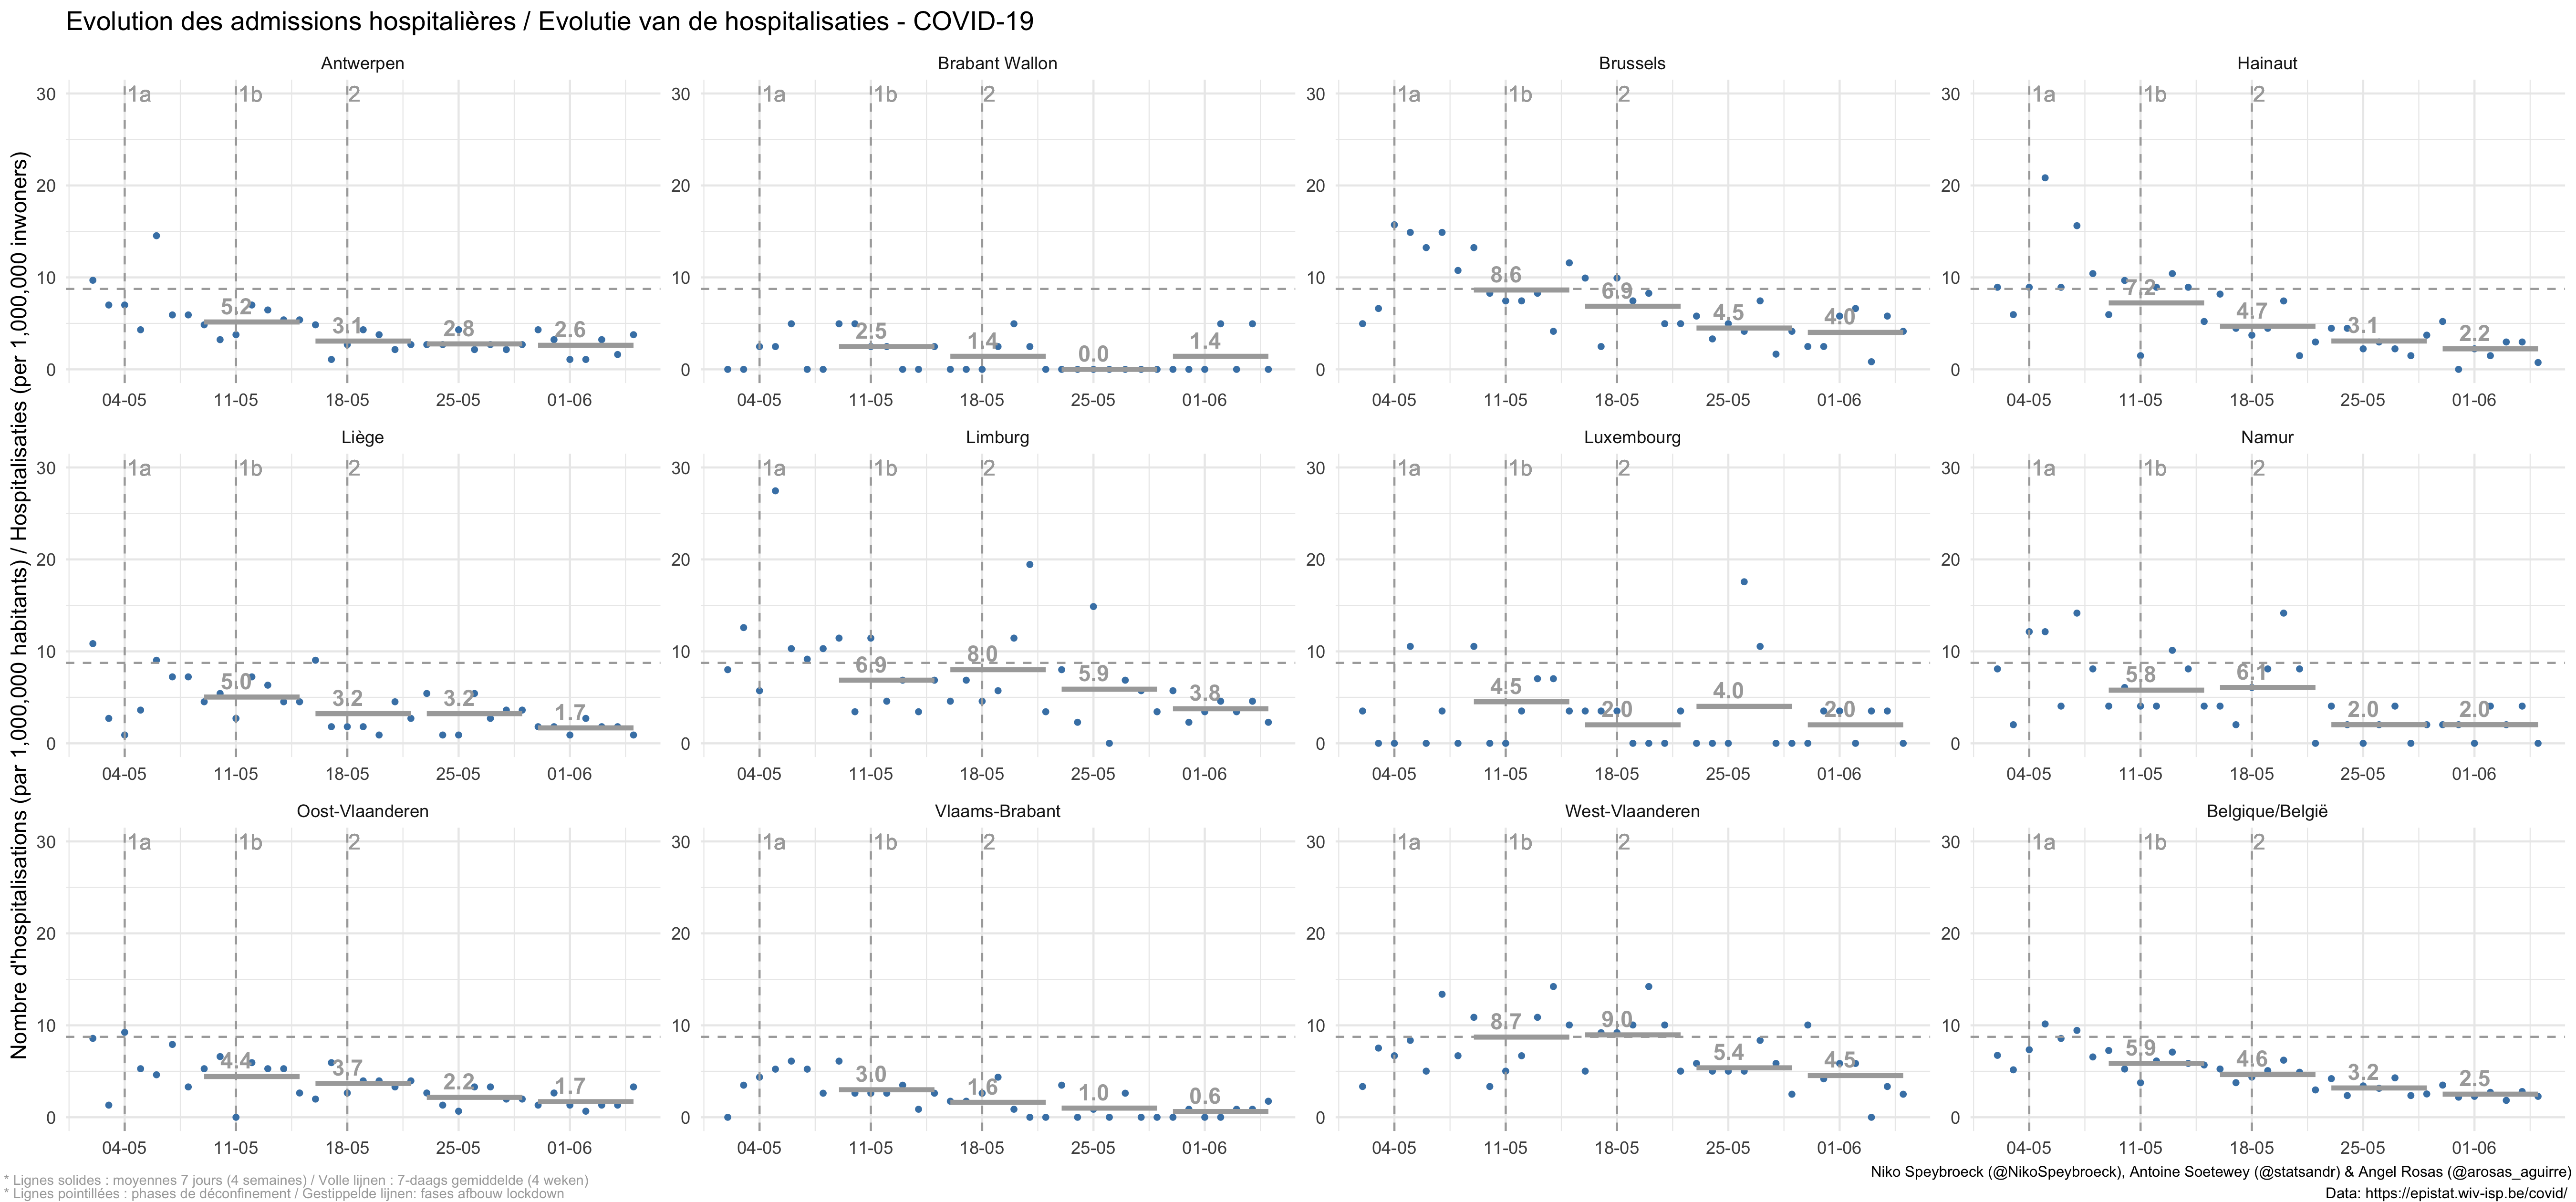
Overall
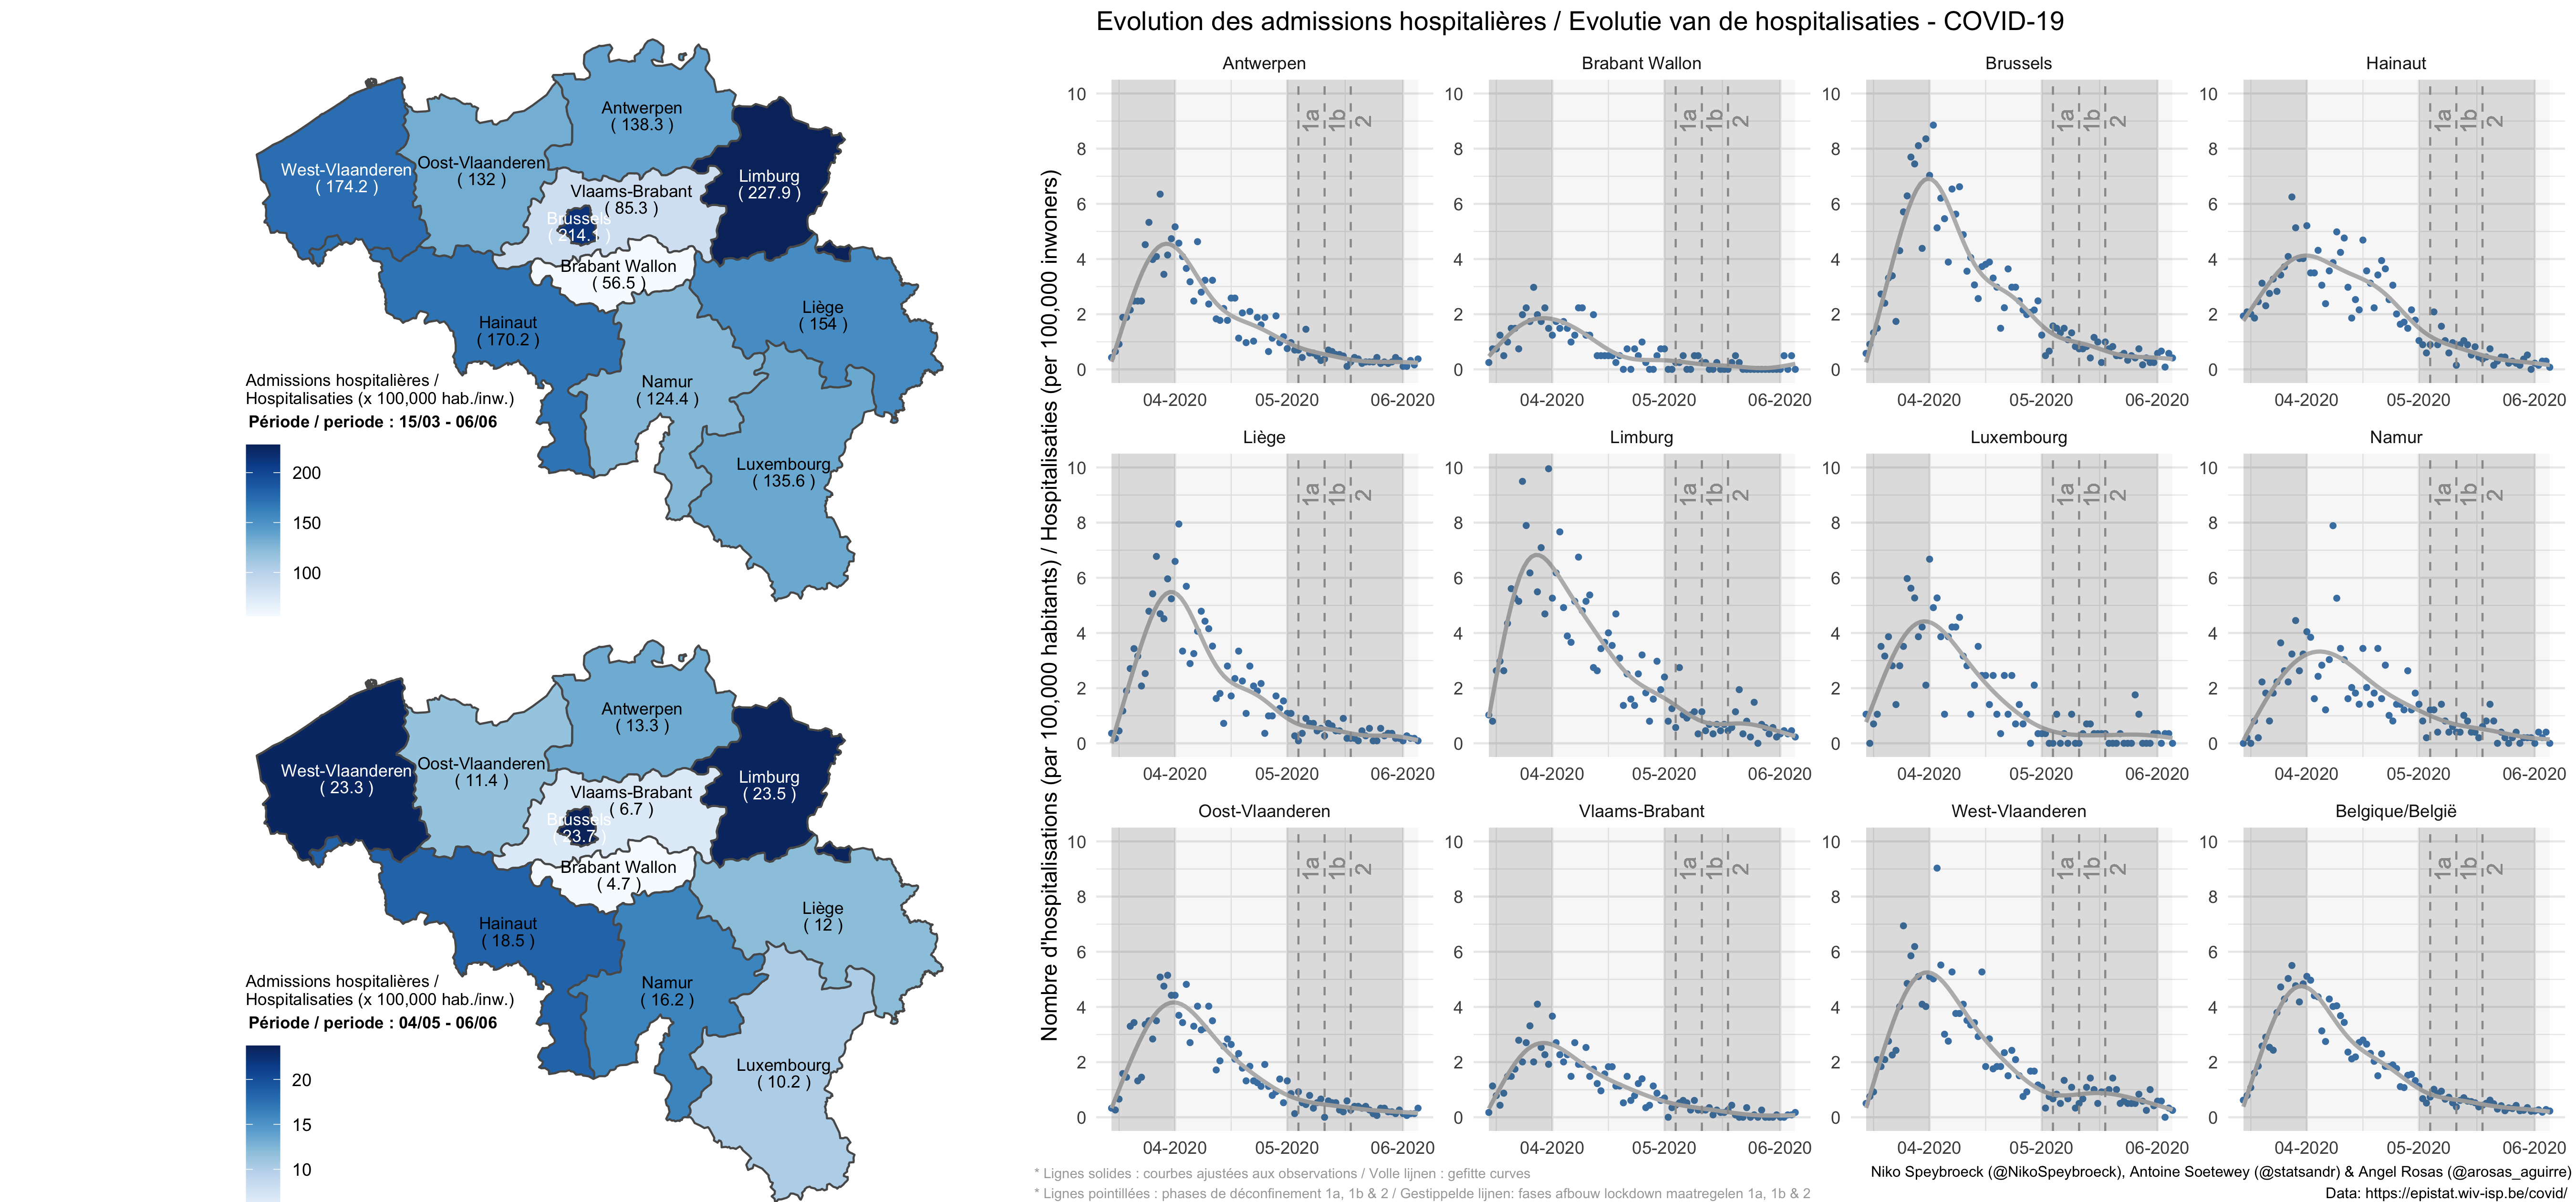
From the above figure, we see that the rate of hospitalizations continue with a decreasing trend in all provinces (and in Belgium as well).
Download the figure, or see the code.
Update of October 27, 2020:

Download the figure, or see the code.
The detailed situation in Brabant:
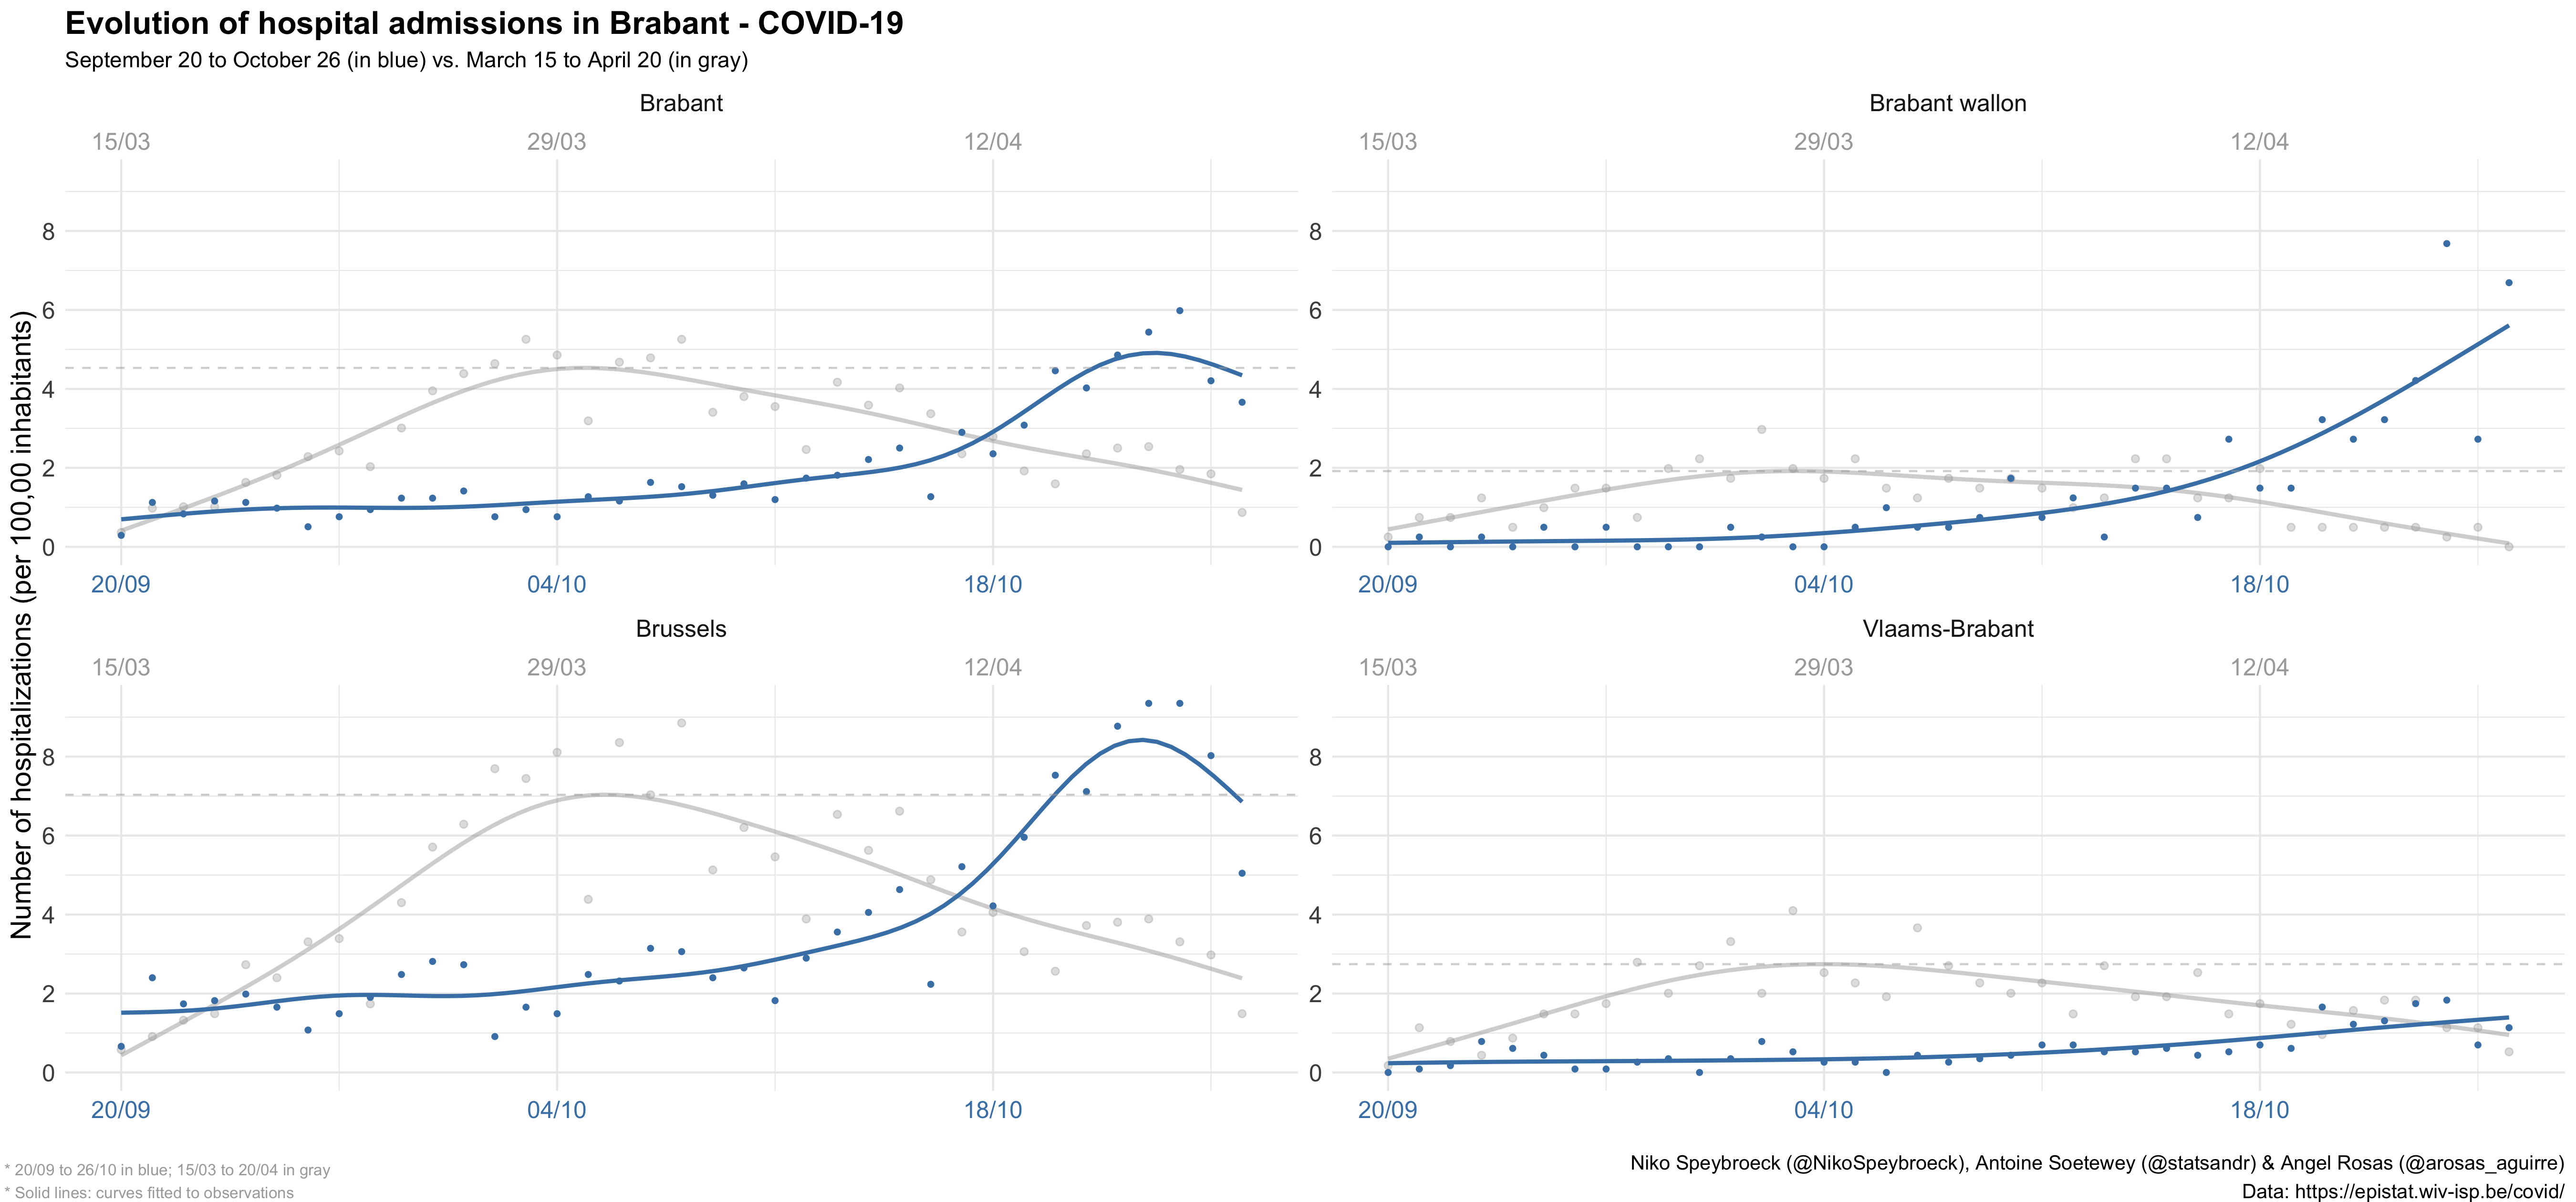
Download the figure, or see the code.
By period
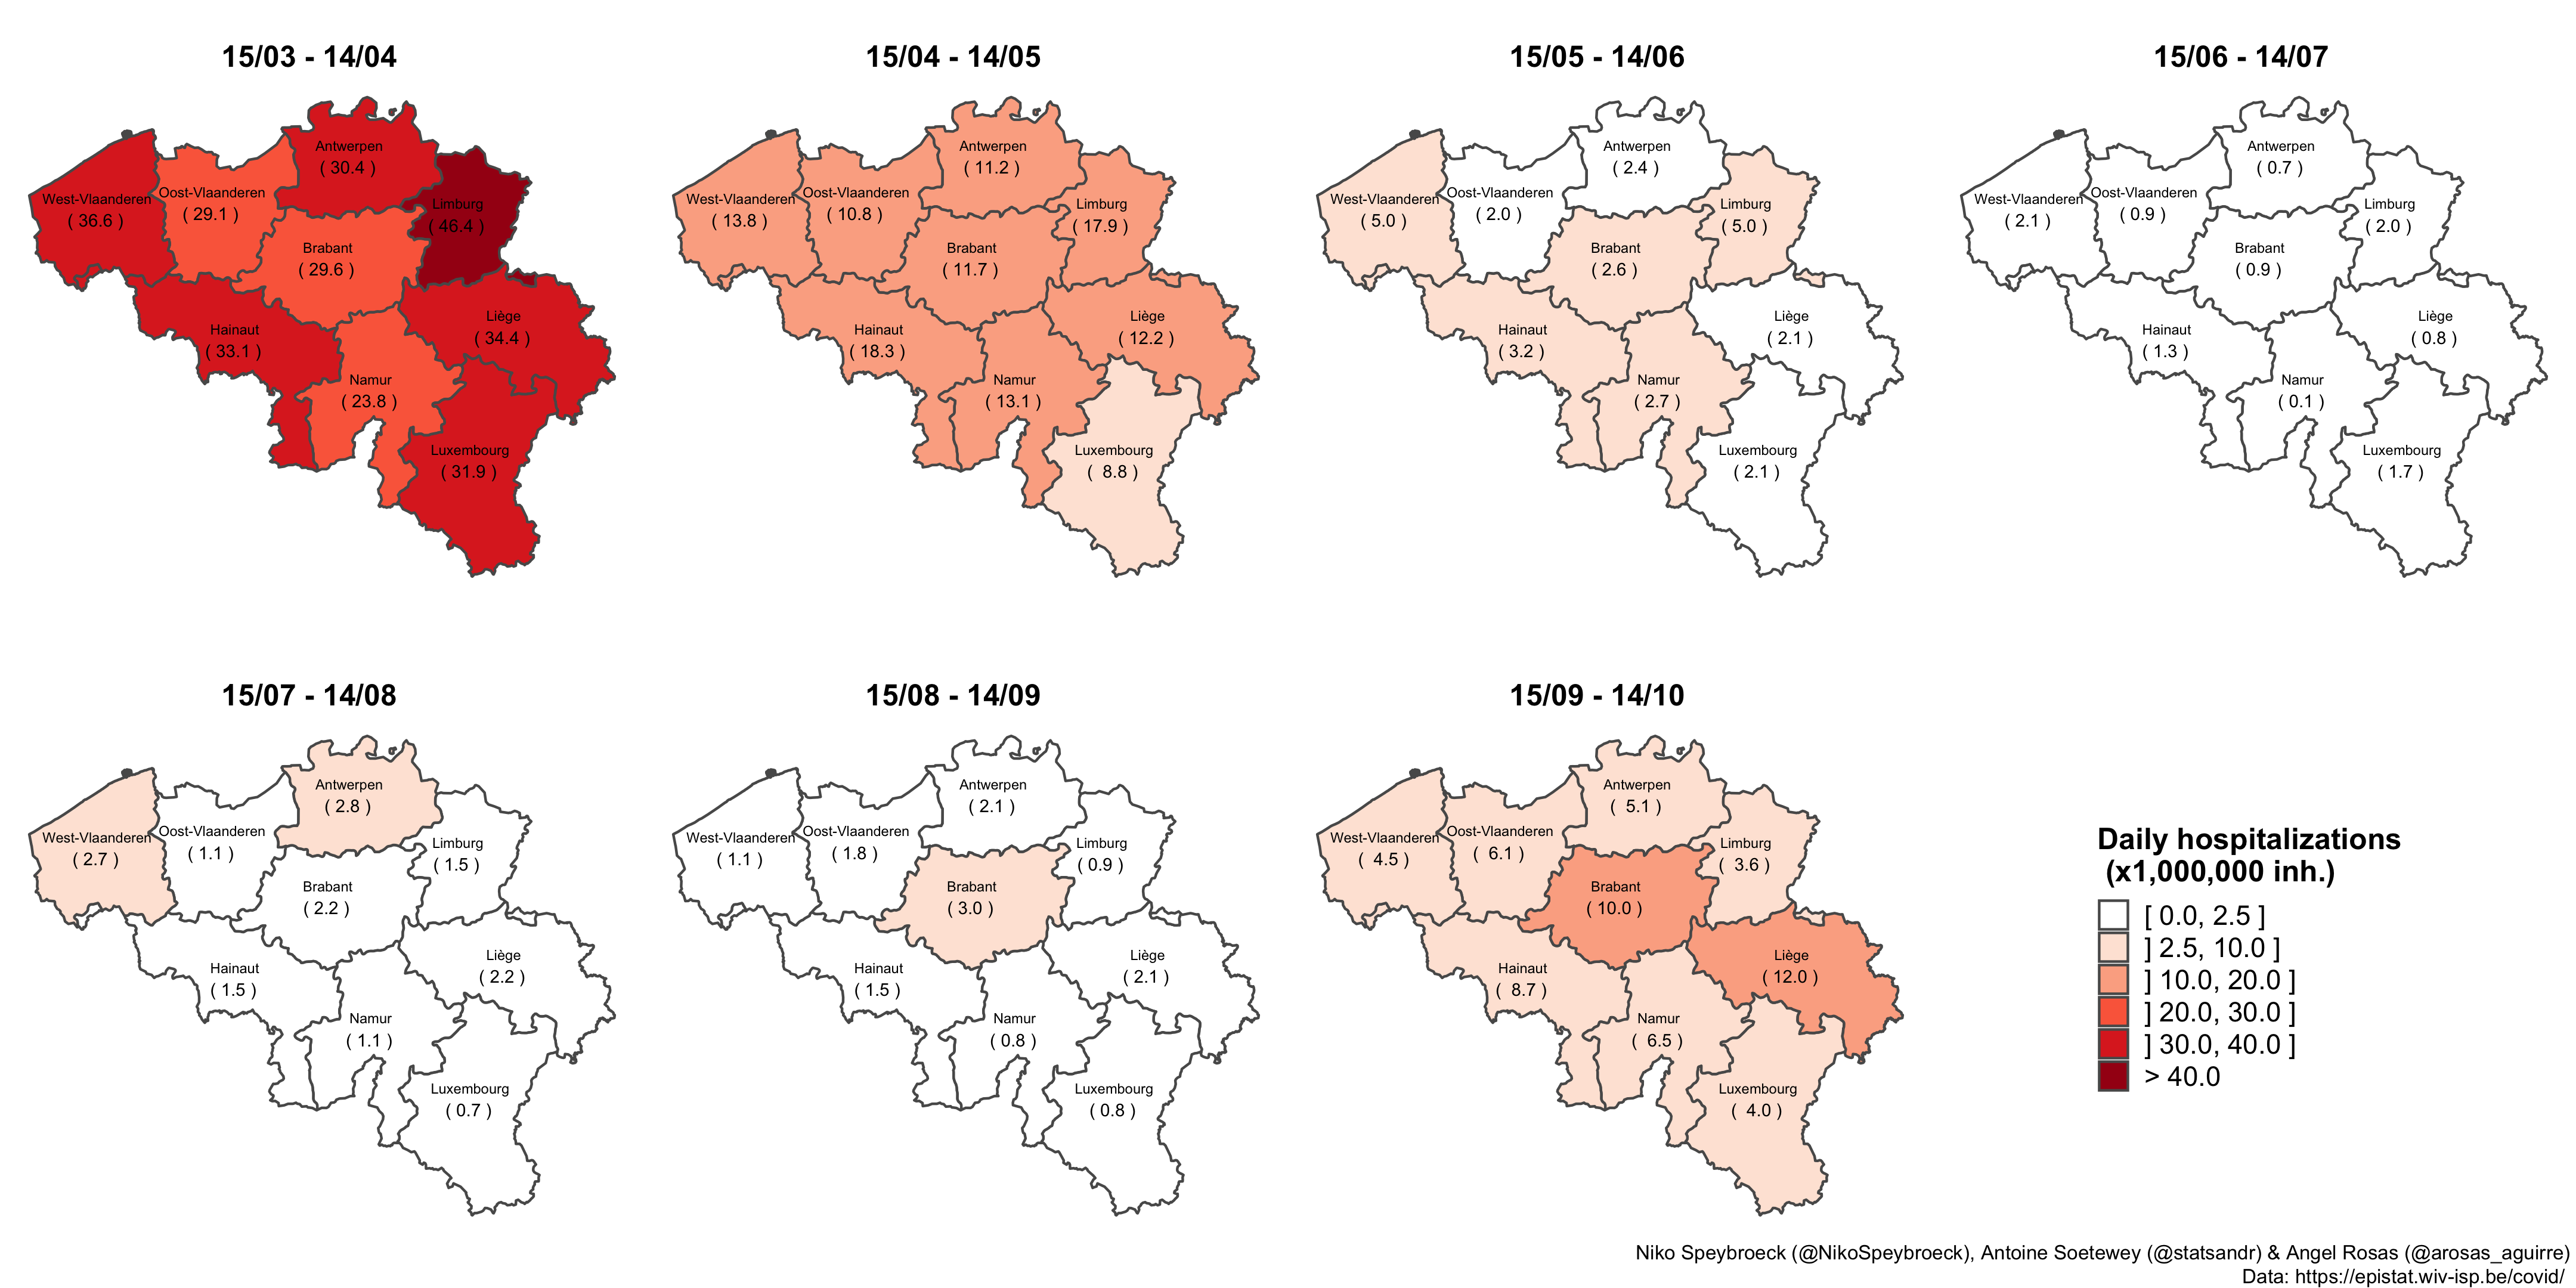
Download the figure, or see the code.
Update of November 16, 2020:
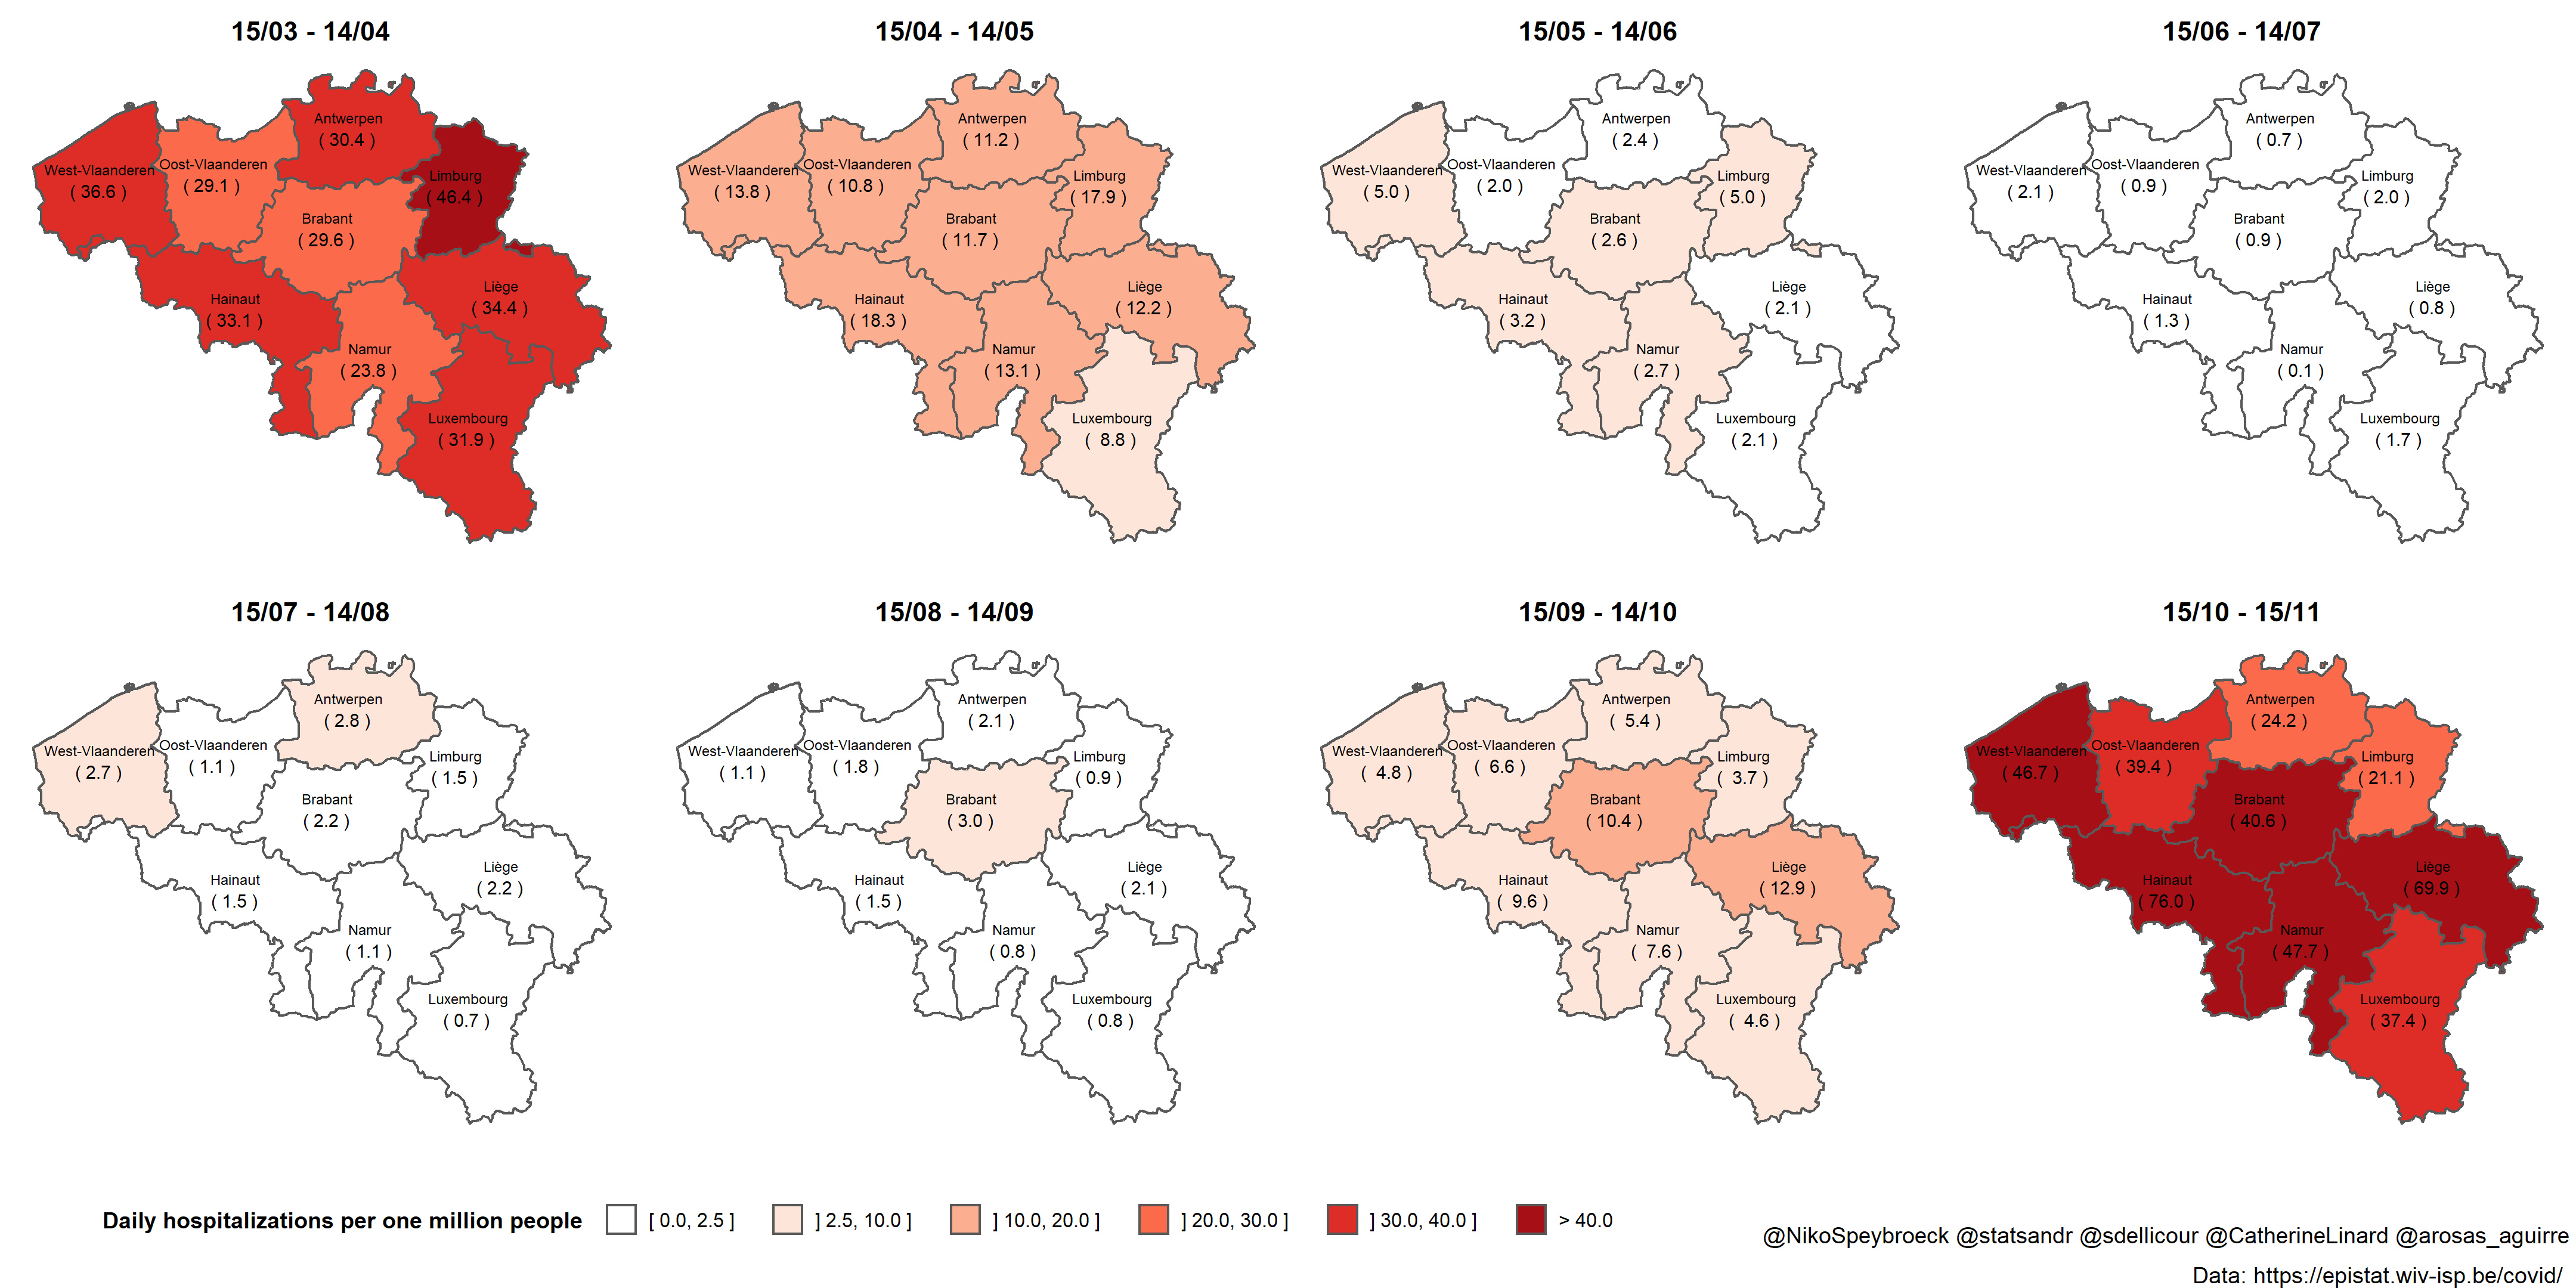
Download the figure.
In the first wave, the province of Limburg recorded on average the highest number of COVID19 hospital admissions per million inhabitants. During the second wave, Liège and Hainaut struggled with the highest rates. With two exceptions (Antwerp and Limburg), last month was worse than in March-April. In three provinces (Hainaut, Namur and Liège), the number has more than doubled.
During the period from June 14 to July 15, 2020, the number of COVID19 hospital admissions in Belgium fell to very low relative levels, but we have failed to maintain them. Now that hospital admissions are no longer increasing, we hope that the colors will lighten up again a bit as the end of the year approaches.
Zooming in
Download the figure or see the code.
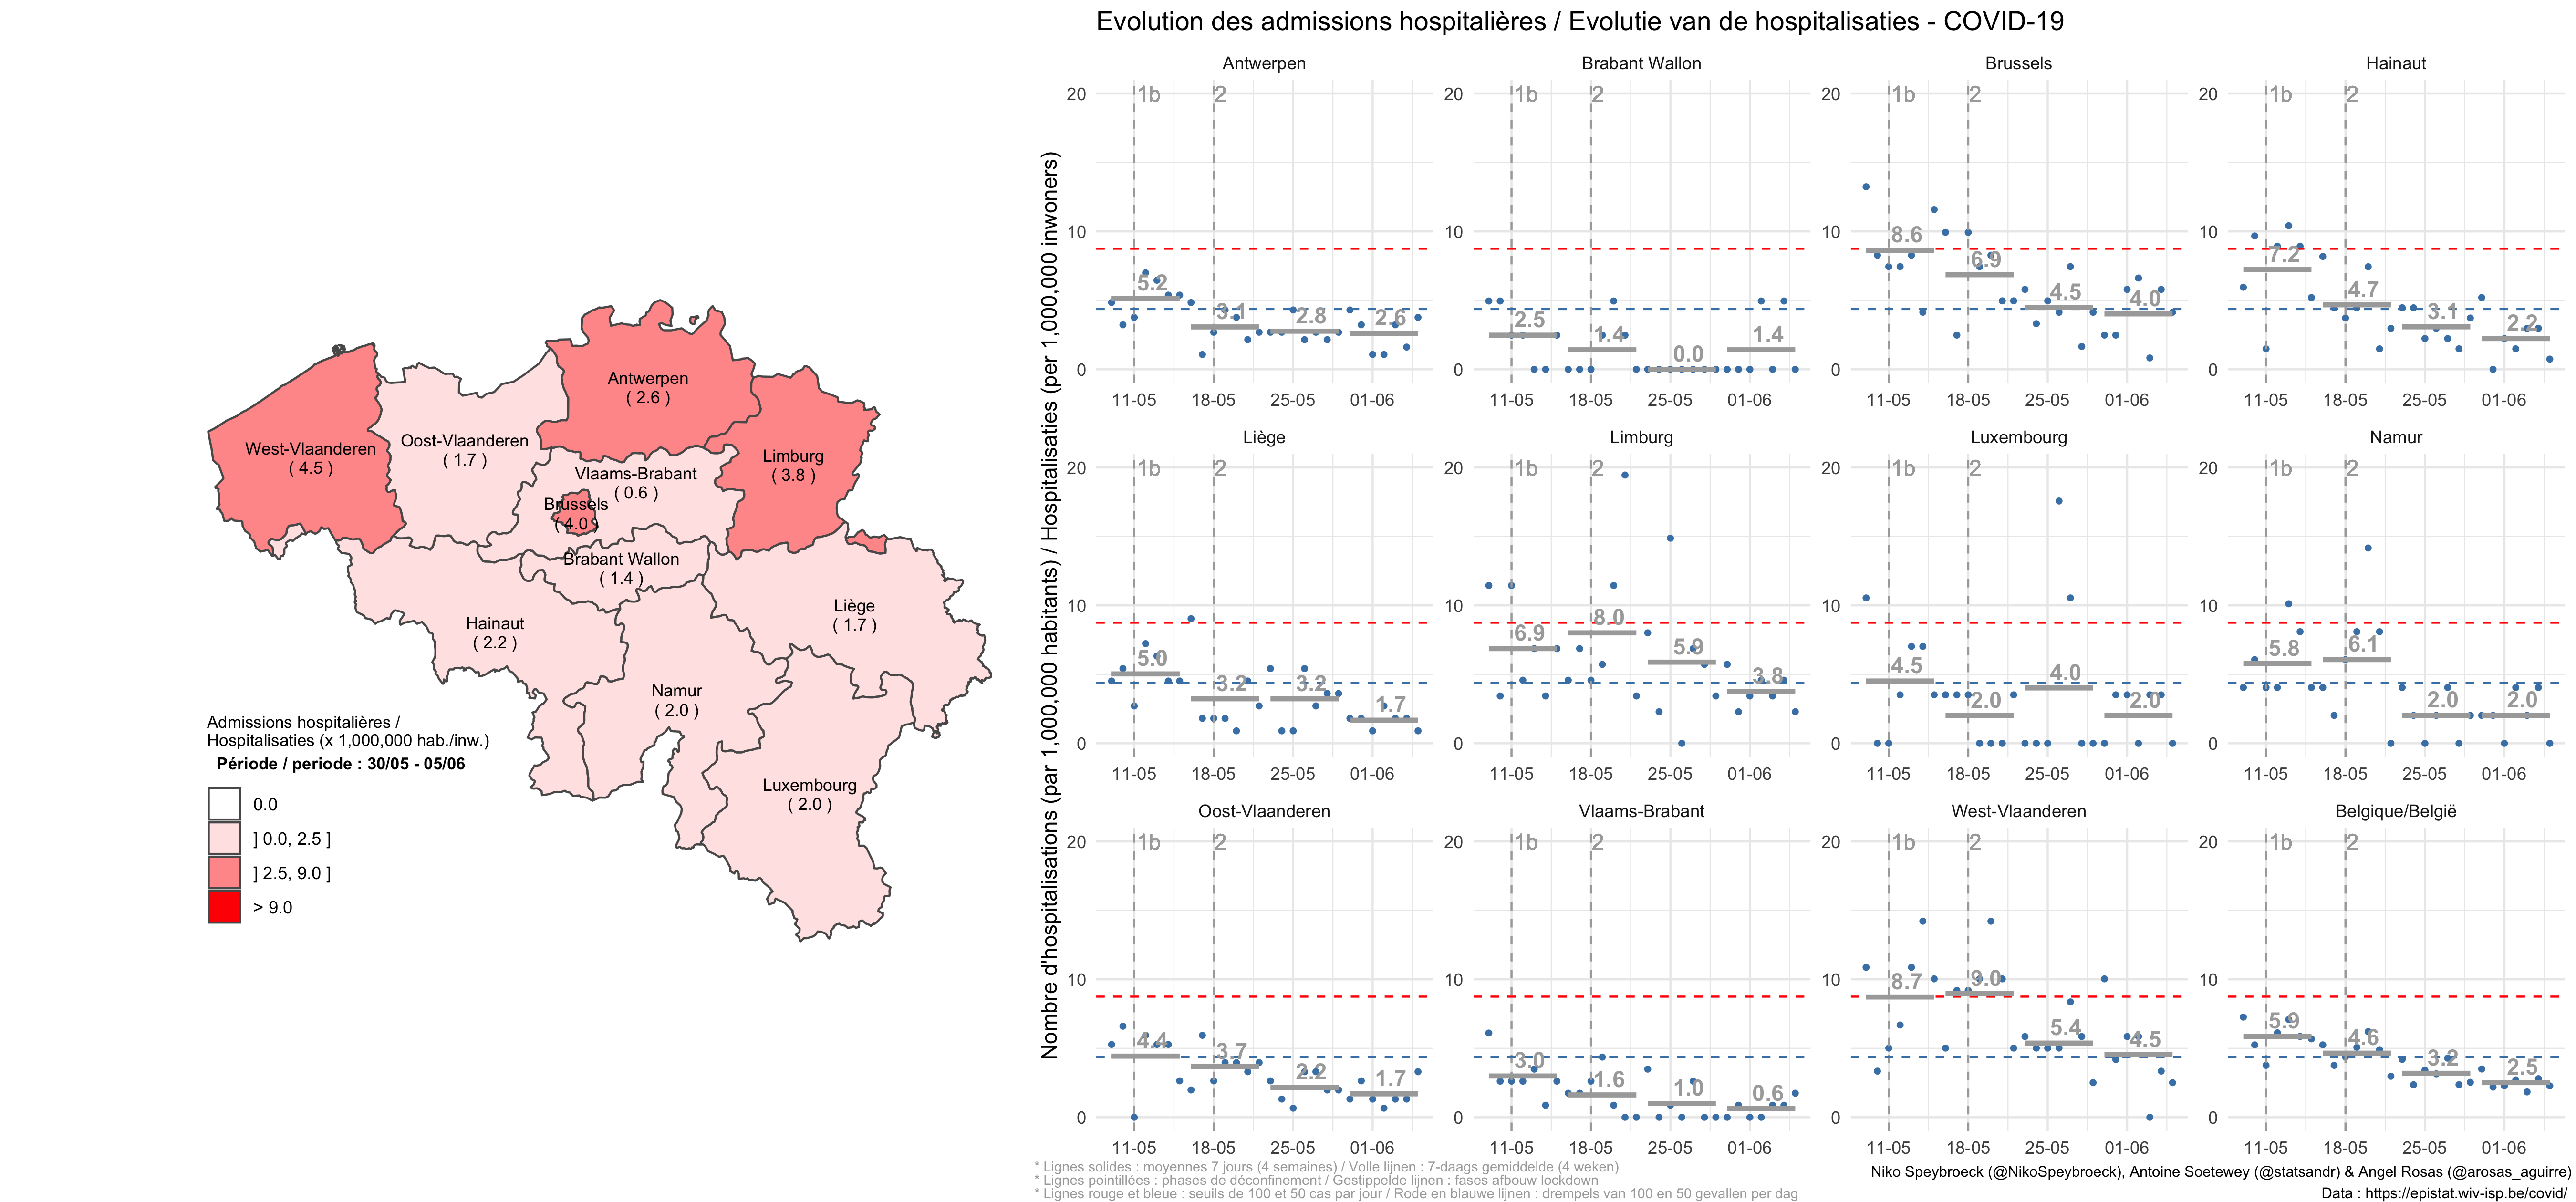
Download the figure or see the code.
Update of February 26, 2021:
There is some ongoing debate in Belgium on whether or not to ease restrictions. On February 26, 2021, Belgian authorities will meet, discuss, debate and decide. Current levels and trends of COVID-19 hospitalizations may guide them:
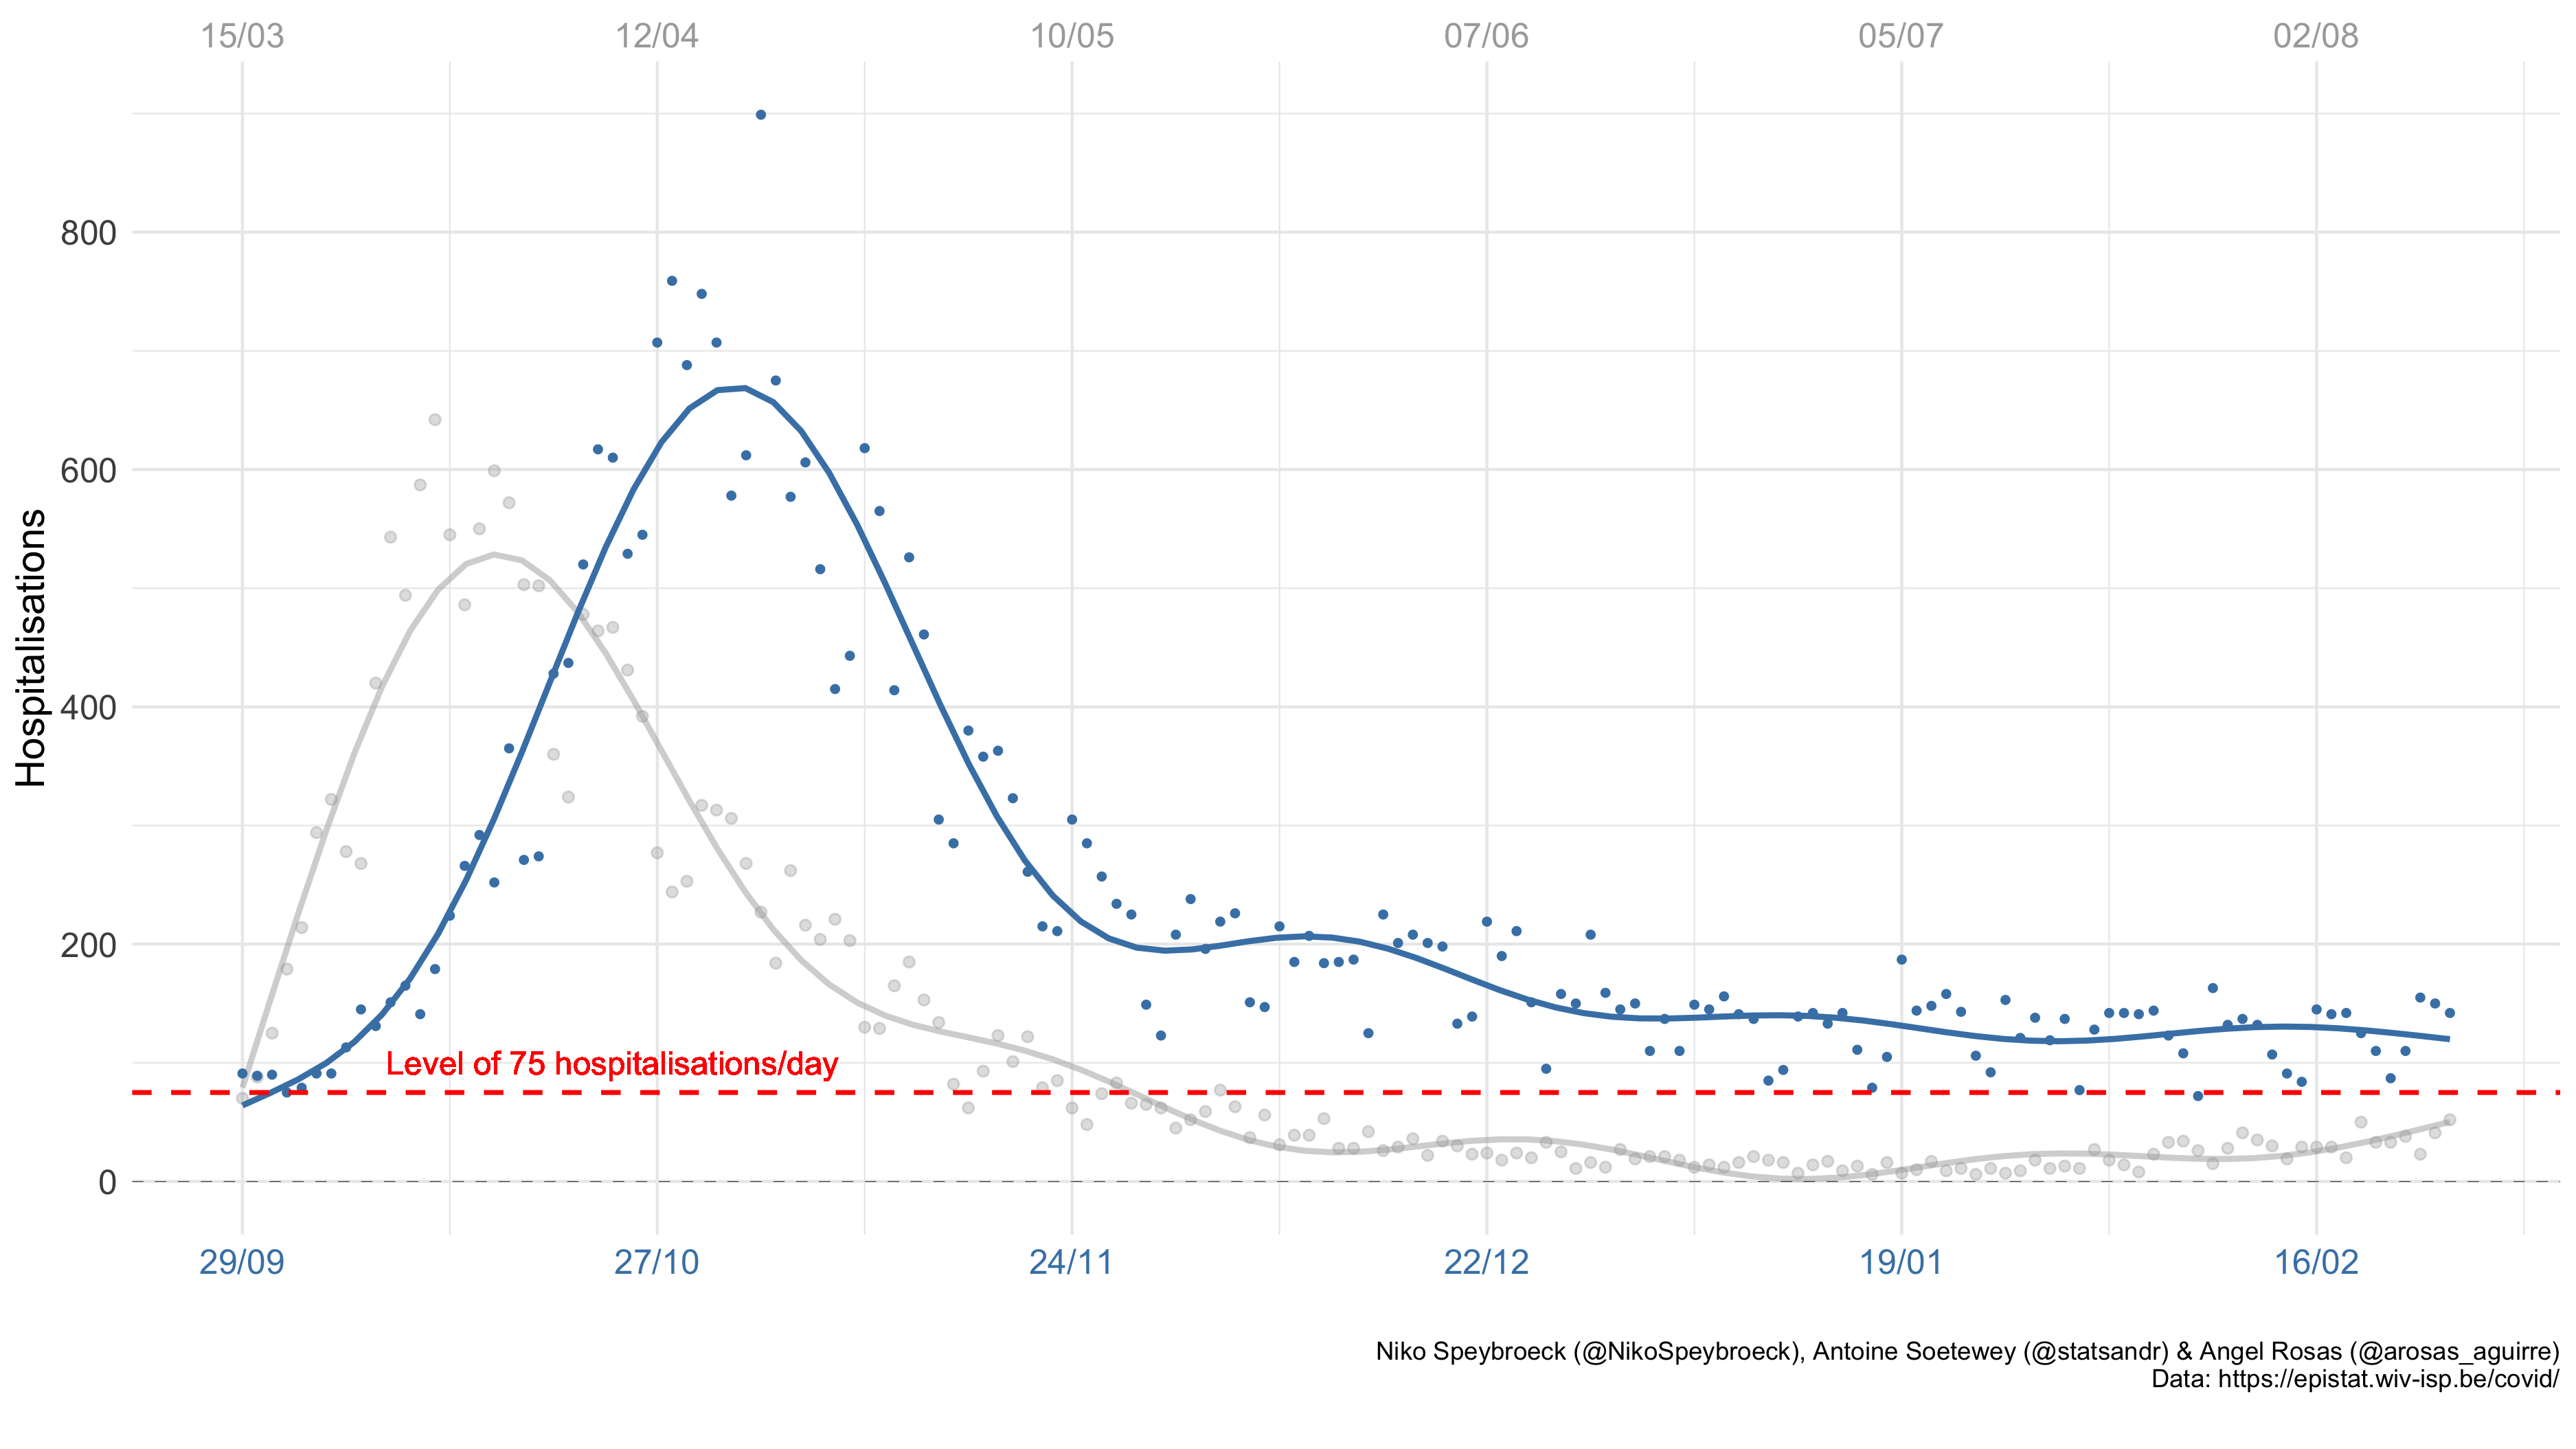
There is still no strong evidence that COVID-19 hospitalization curves decrease in Belgium. The comparison between the first (in gray - dates & curve) and second wave (in blue - dates & curve) needs to be done with care, but indicates that current hospitalization levels are not as low as some may like:
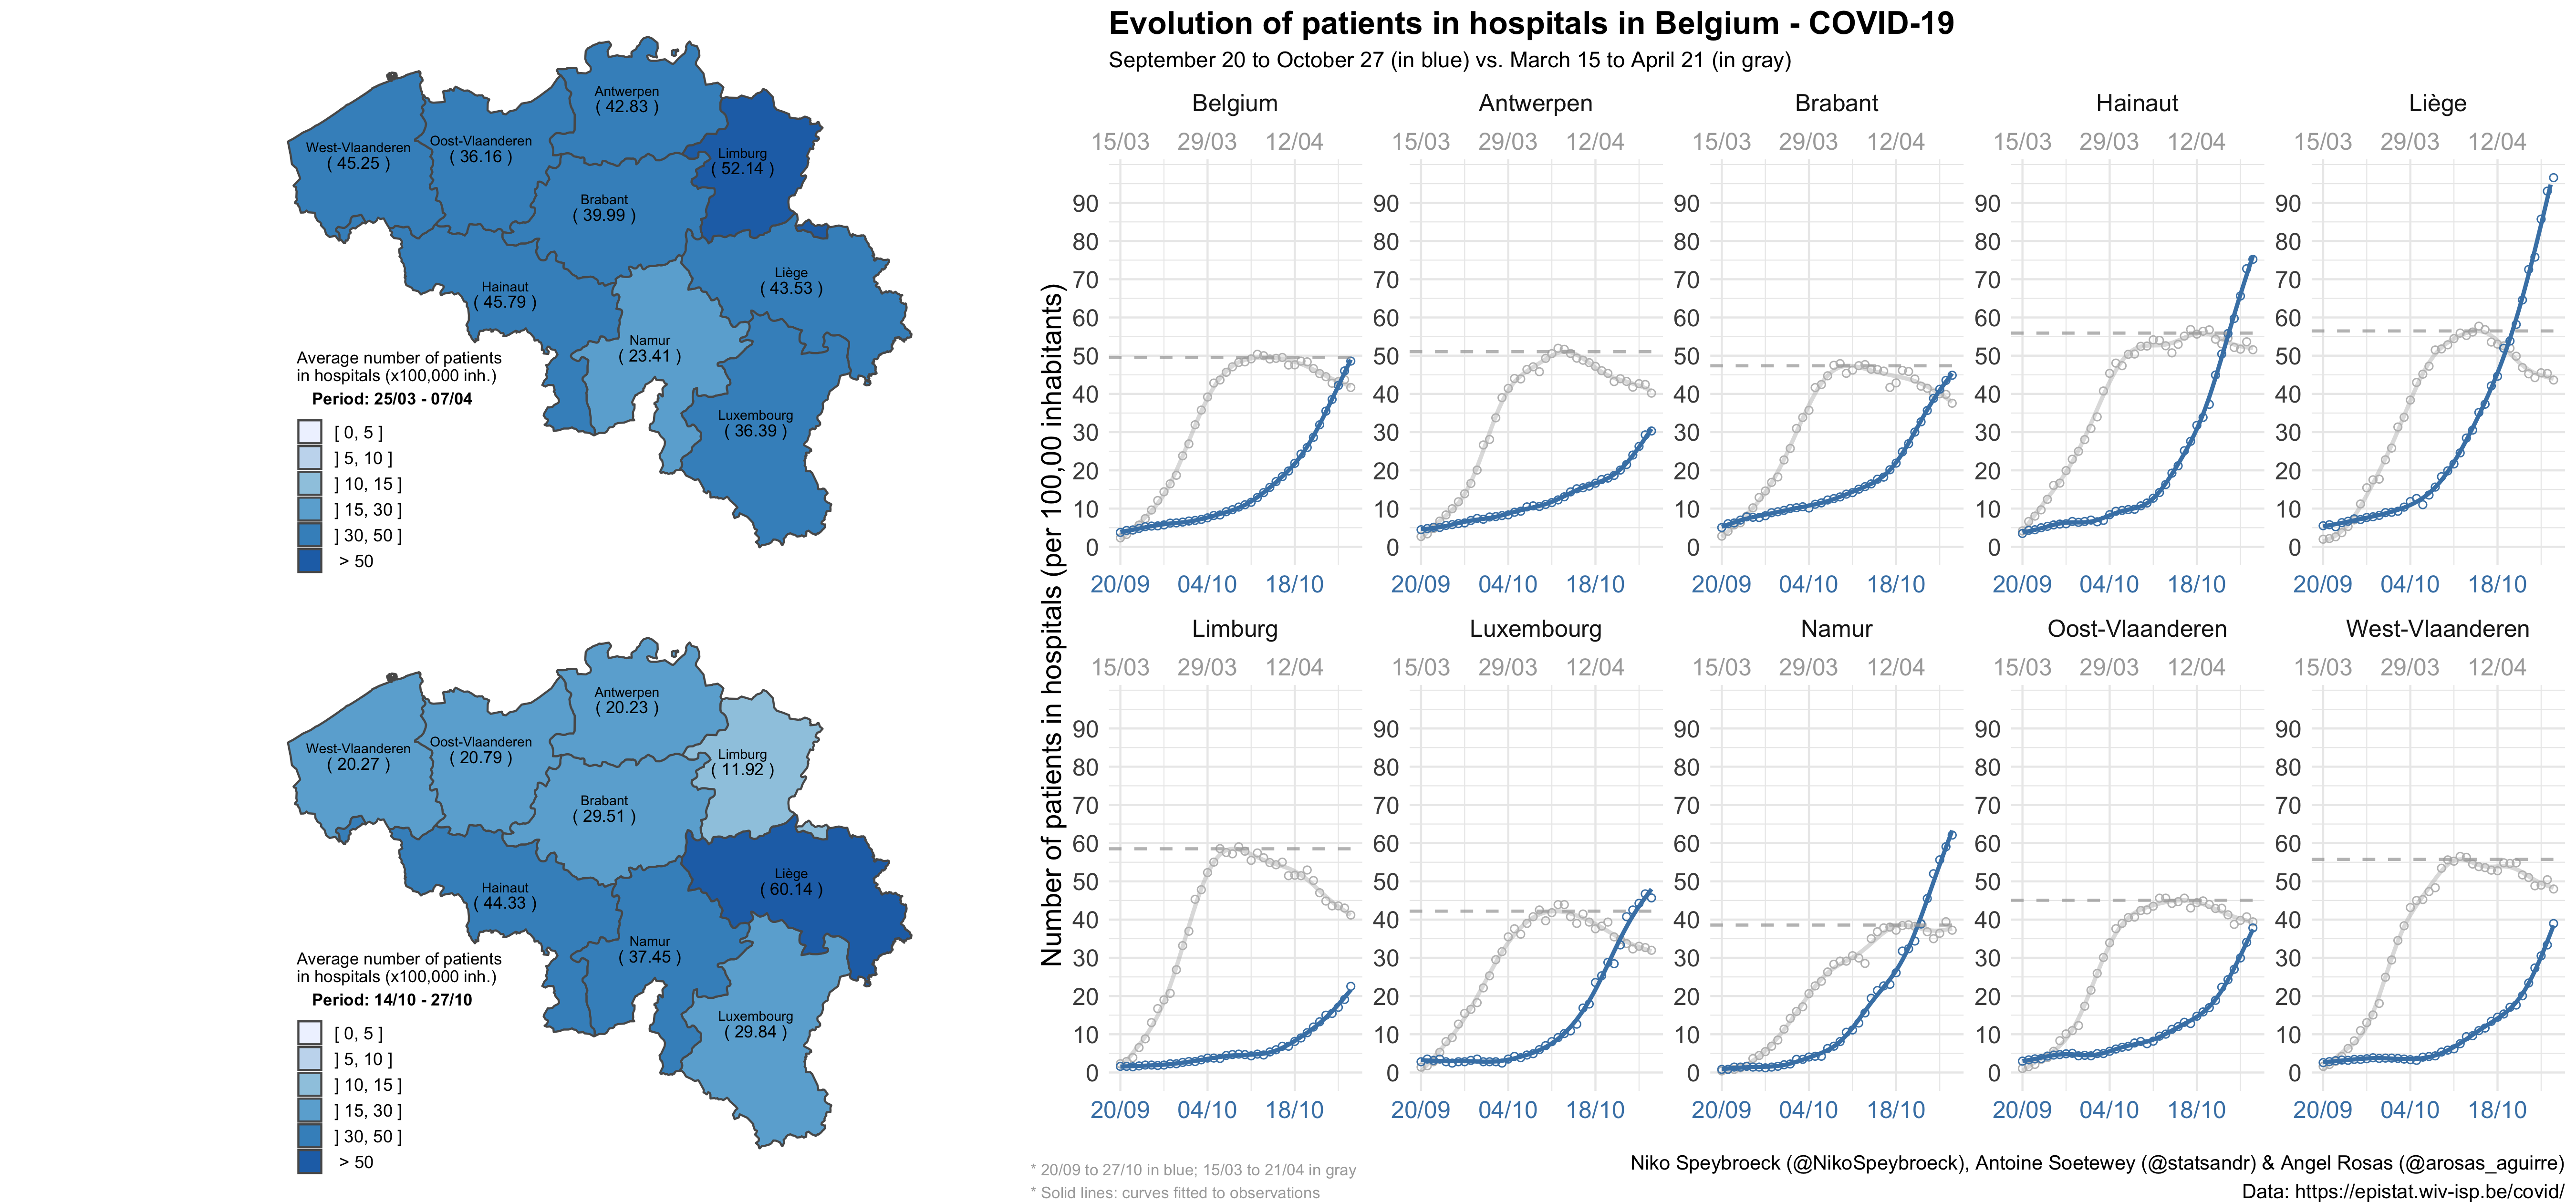
Zooming in provides some additional insights on the COVID-19 levels during the first and second waves at province level:

This shows that the second wave resulted in more hospitalizations than the first one in most Belgian provinces, despite the warning of a first deadly wave. It also illustrates the fact that daily hospitalizations in Belgium are currently still higher than what was observed at the end of the first wave.
Put simply, the bad news is that the combination of the number of contacts and the risk of transmission by contact seems (at the moment) not sufficiently low to result in a considerable decrease of hospitalizations. Yet (put simply), the good news today is that there is already some immunity in the population and that vaccinations may increase this immunity considerably. This can help in pushing curves down. Let’s not lose hope.
Download figures (1, 2 and 3) or see the code.
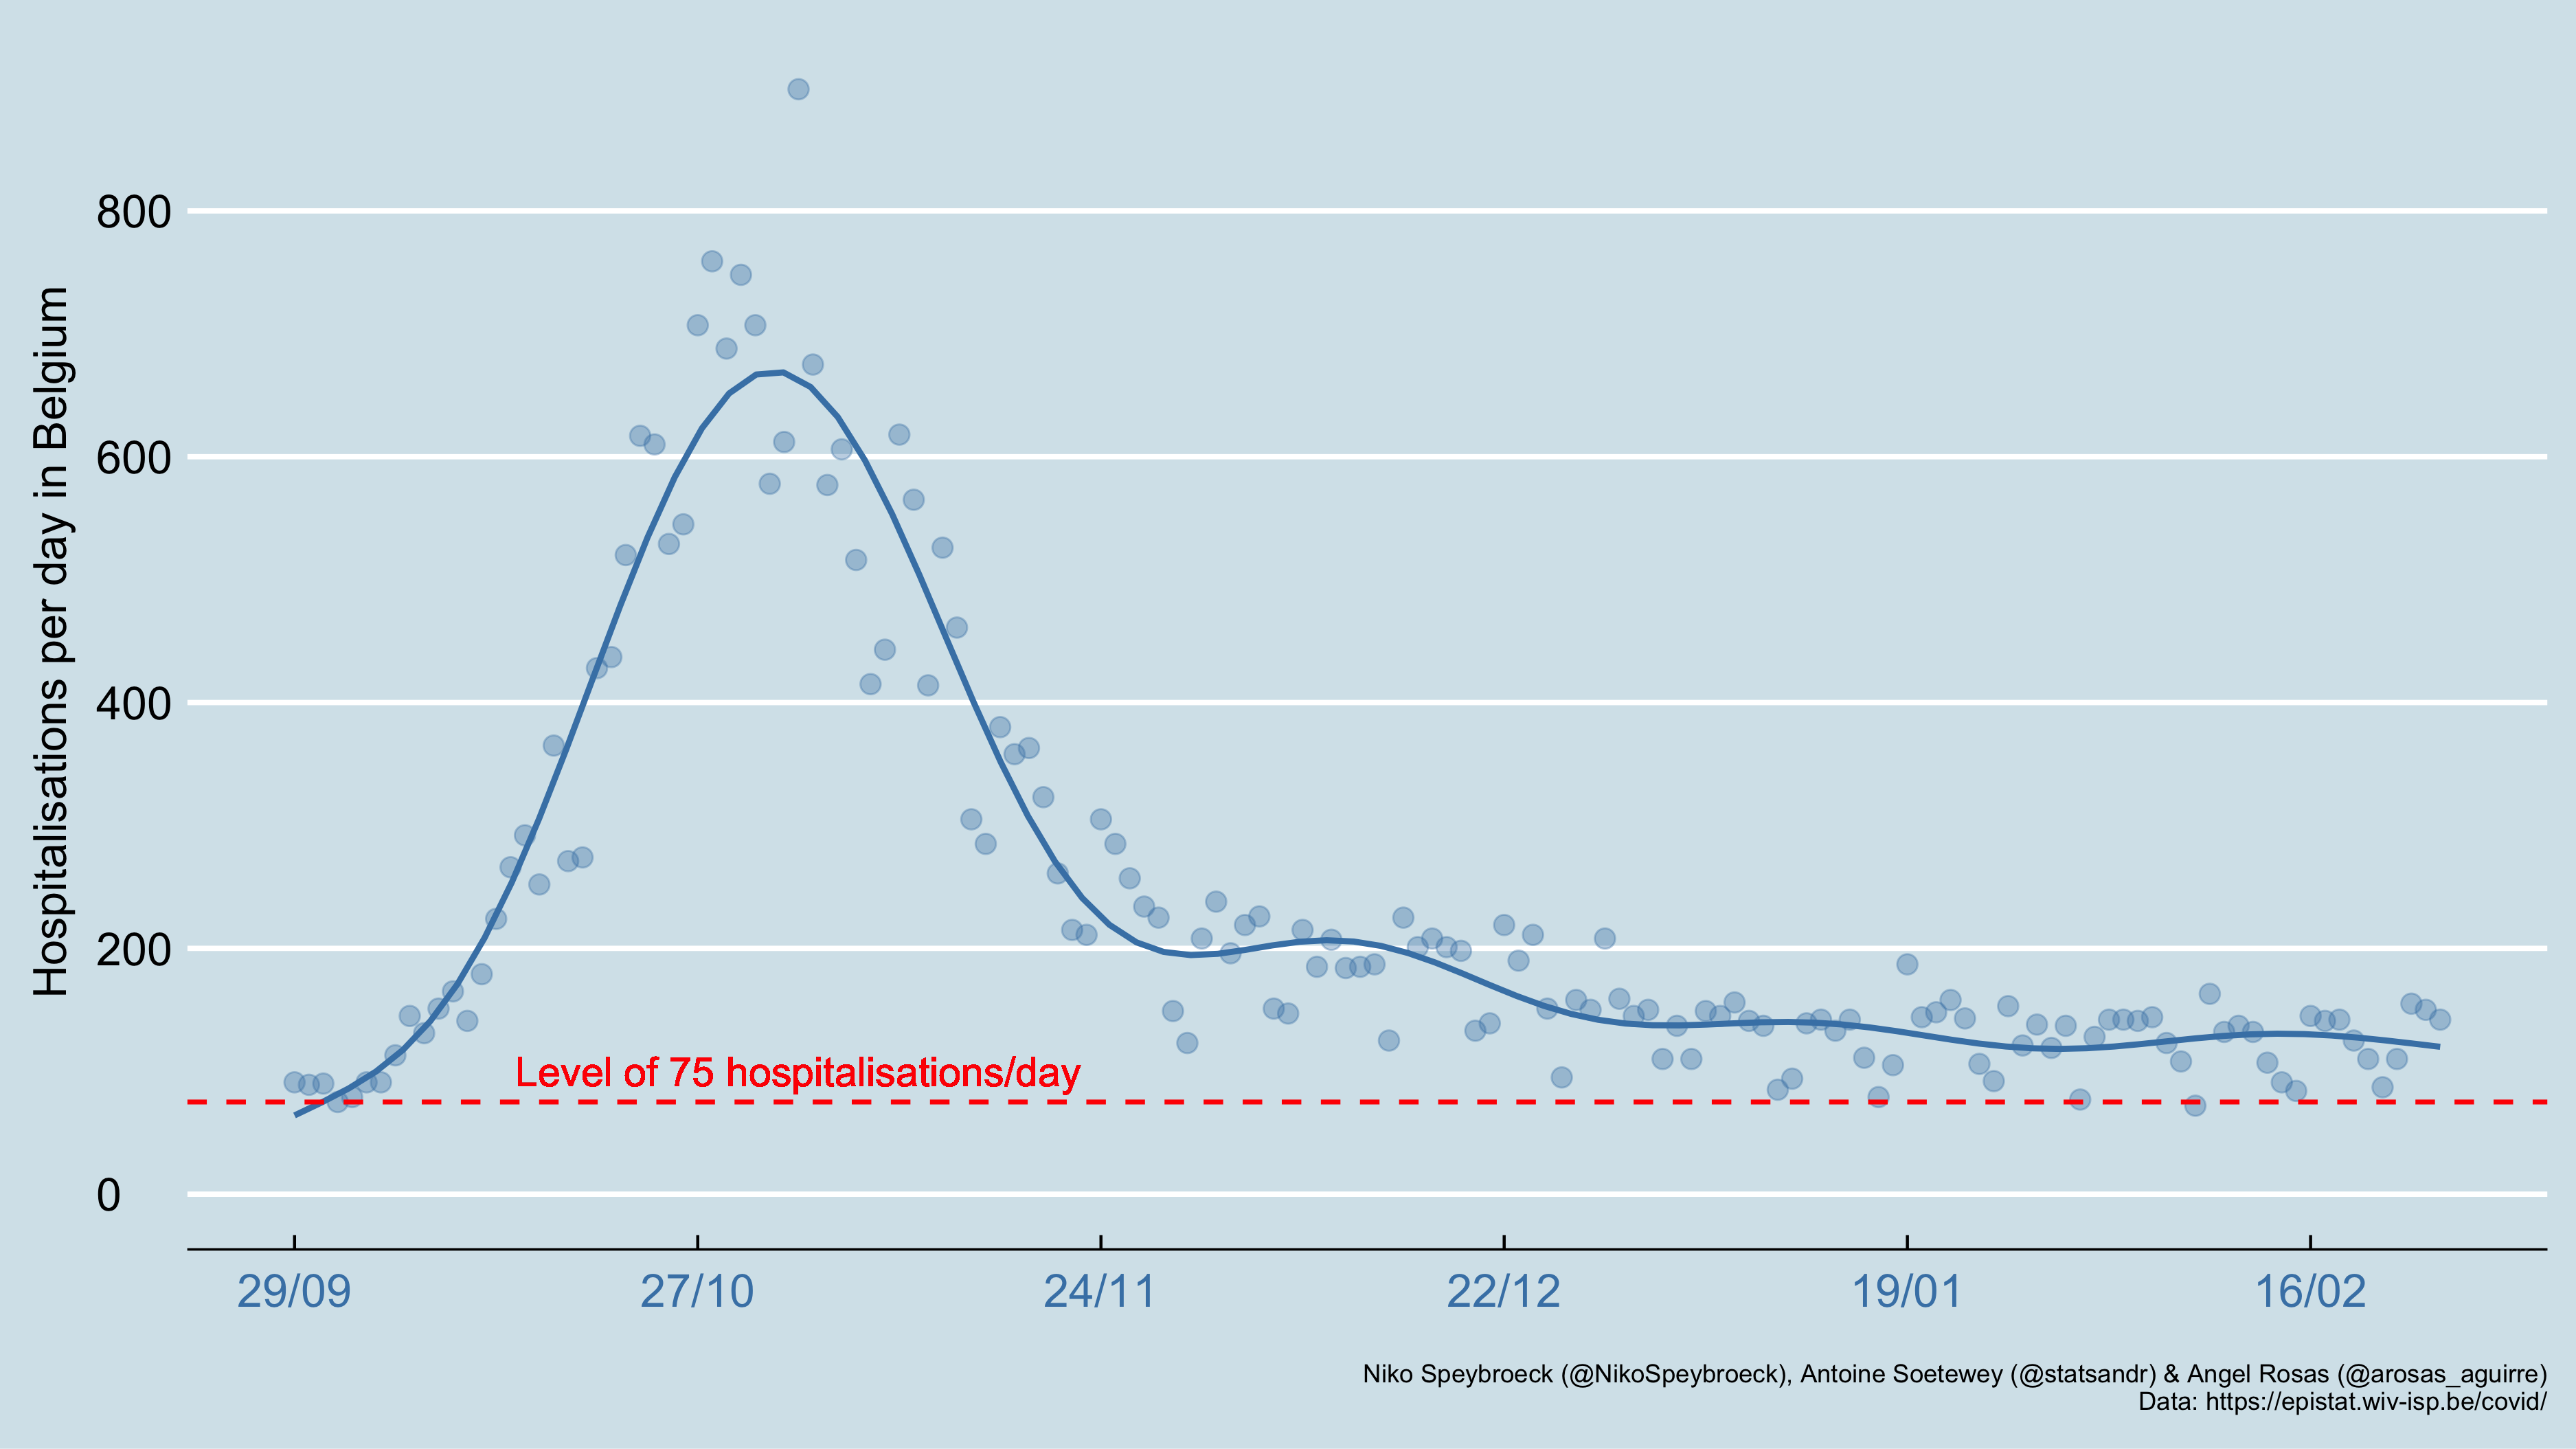
Update of May 10, 2021:
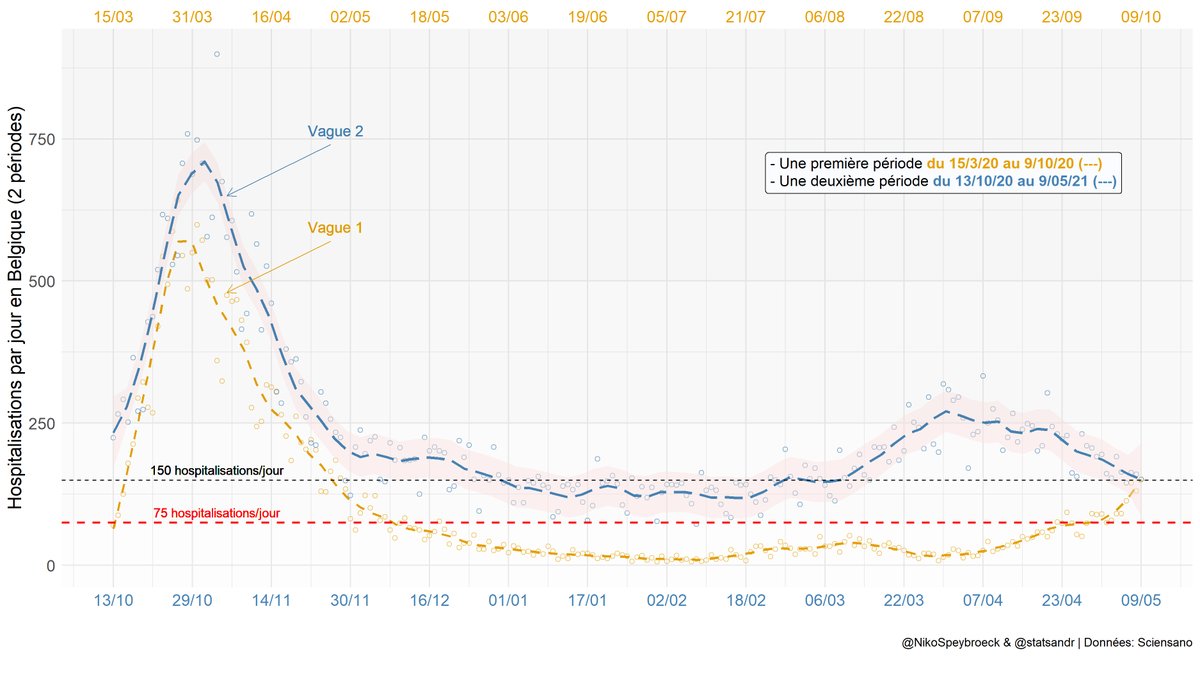
When looking at the above plot, bad news are that:
- current levels correspond to levels of October 2020 and
- current levels are still about double the target of 75 hospitalizations per day.
There are, however, three good news (compared to October 2020):
- decreasing curve,
- vaccination and
- good weather.
Update of June 4, 2021

The good news is that the number of COVID-19 hospitalizations in Belgium is now below the well-known threshold of 75 hospitalizations per day (which is a target defined by the Belgian government). This is the way to go, and we hope this trend will continue in the coming days/weeks.
Patients in hospitals
Below the evolution of the number of patients in hospitals in Belgium:
Download the figure or see the code.
We see that, as of October 28, 2020, the number of COVID19 patients in Belgian hospitals reached the peak of the first wave. So although patients stay shorter at the hospital during the second wave compared to the first wave, hospitals are still getting crowded.
Therefore, if the number of patients in hospitals follows the same path in the coming weeks, hospitals will quickly become too crowded and will not be able to accept new patients as their maximum capacity will soon be reached (if this is not already the case…).
Patients in intensive care
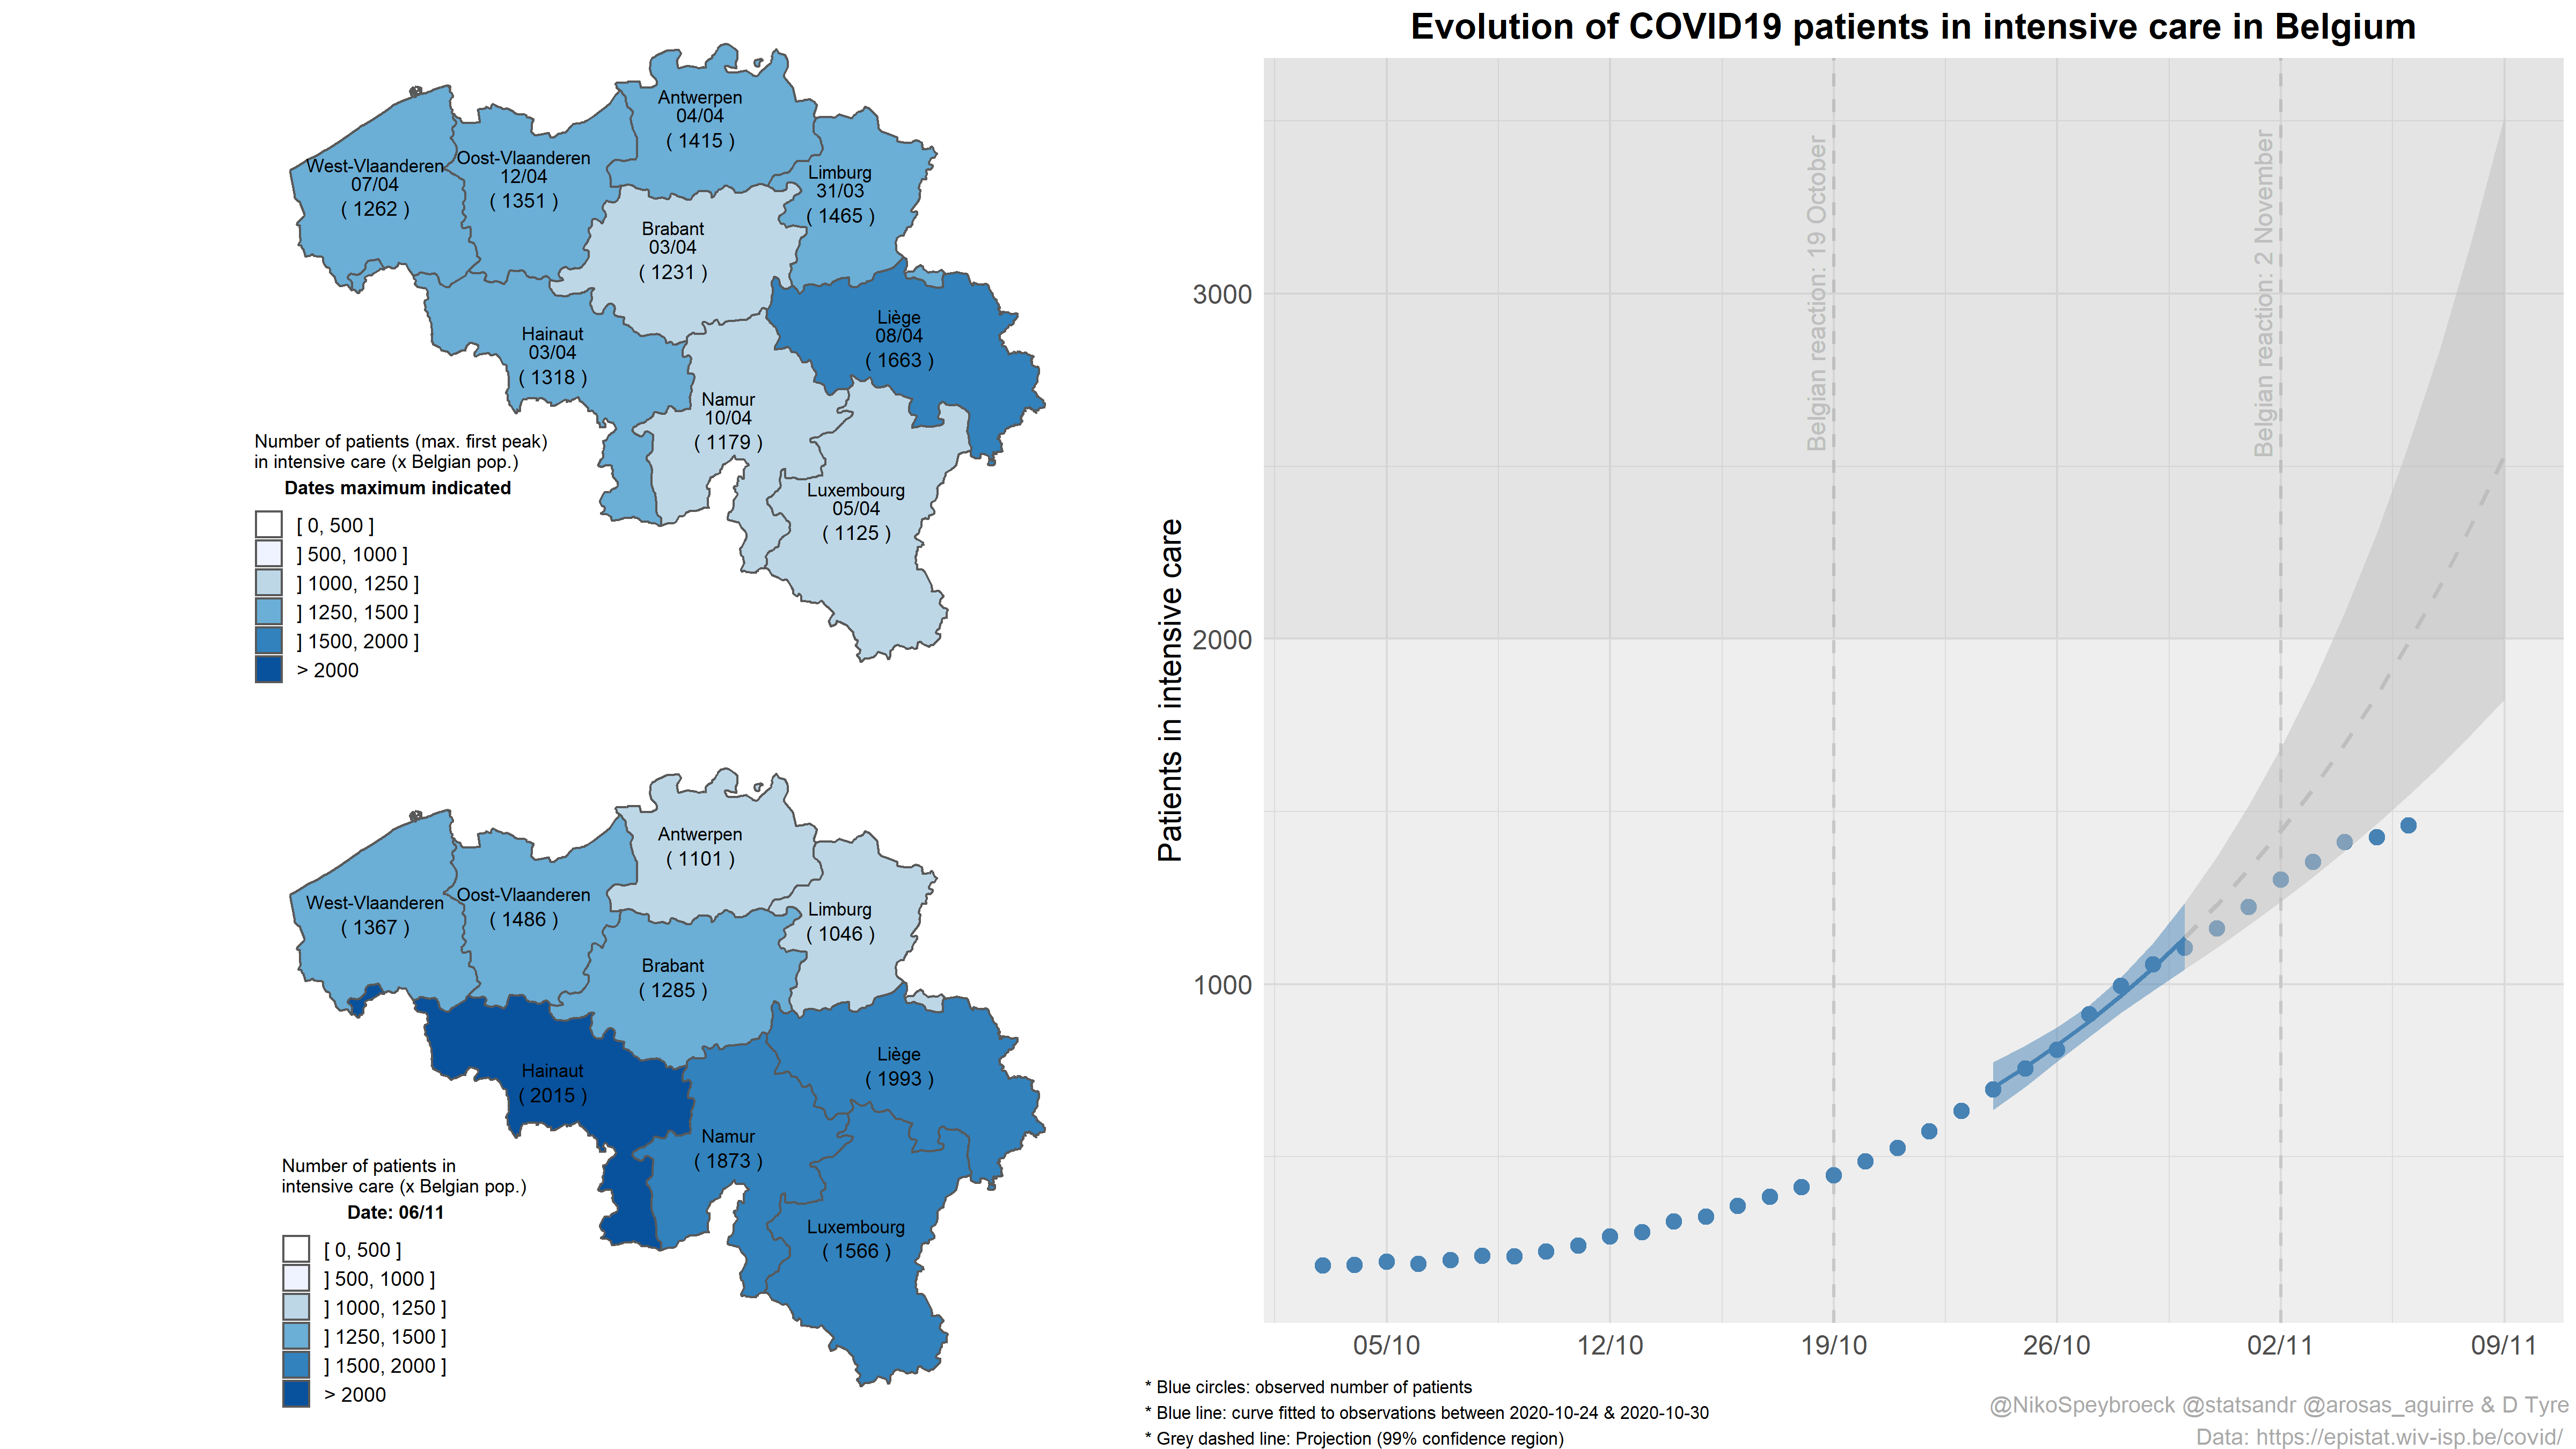
Below the evolution of COVID19 patients in intensive care in Belgium, with short-term projections and 99% confidence interval:
Download the figure.
Short-term projections indicate what may have happened without the slow-down in transmission. This slow-down is positive news.
The maps show total intensive care patients by province if these would have had the Belgian population. Map at the top shows maximum levels in March-April and map at the bottom shows current levels. The maps indicate high intensive care use due to COVID19. In most Belgian provinces, numbers are still higher today than March-April peak numbers.
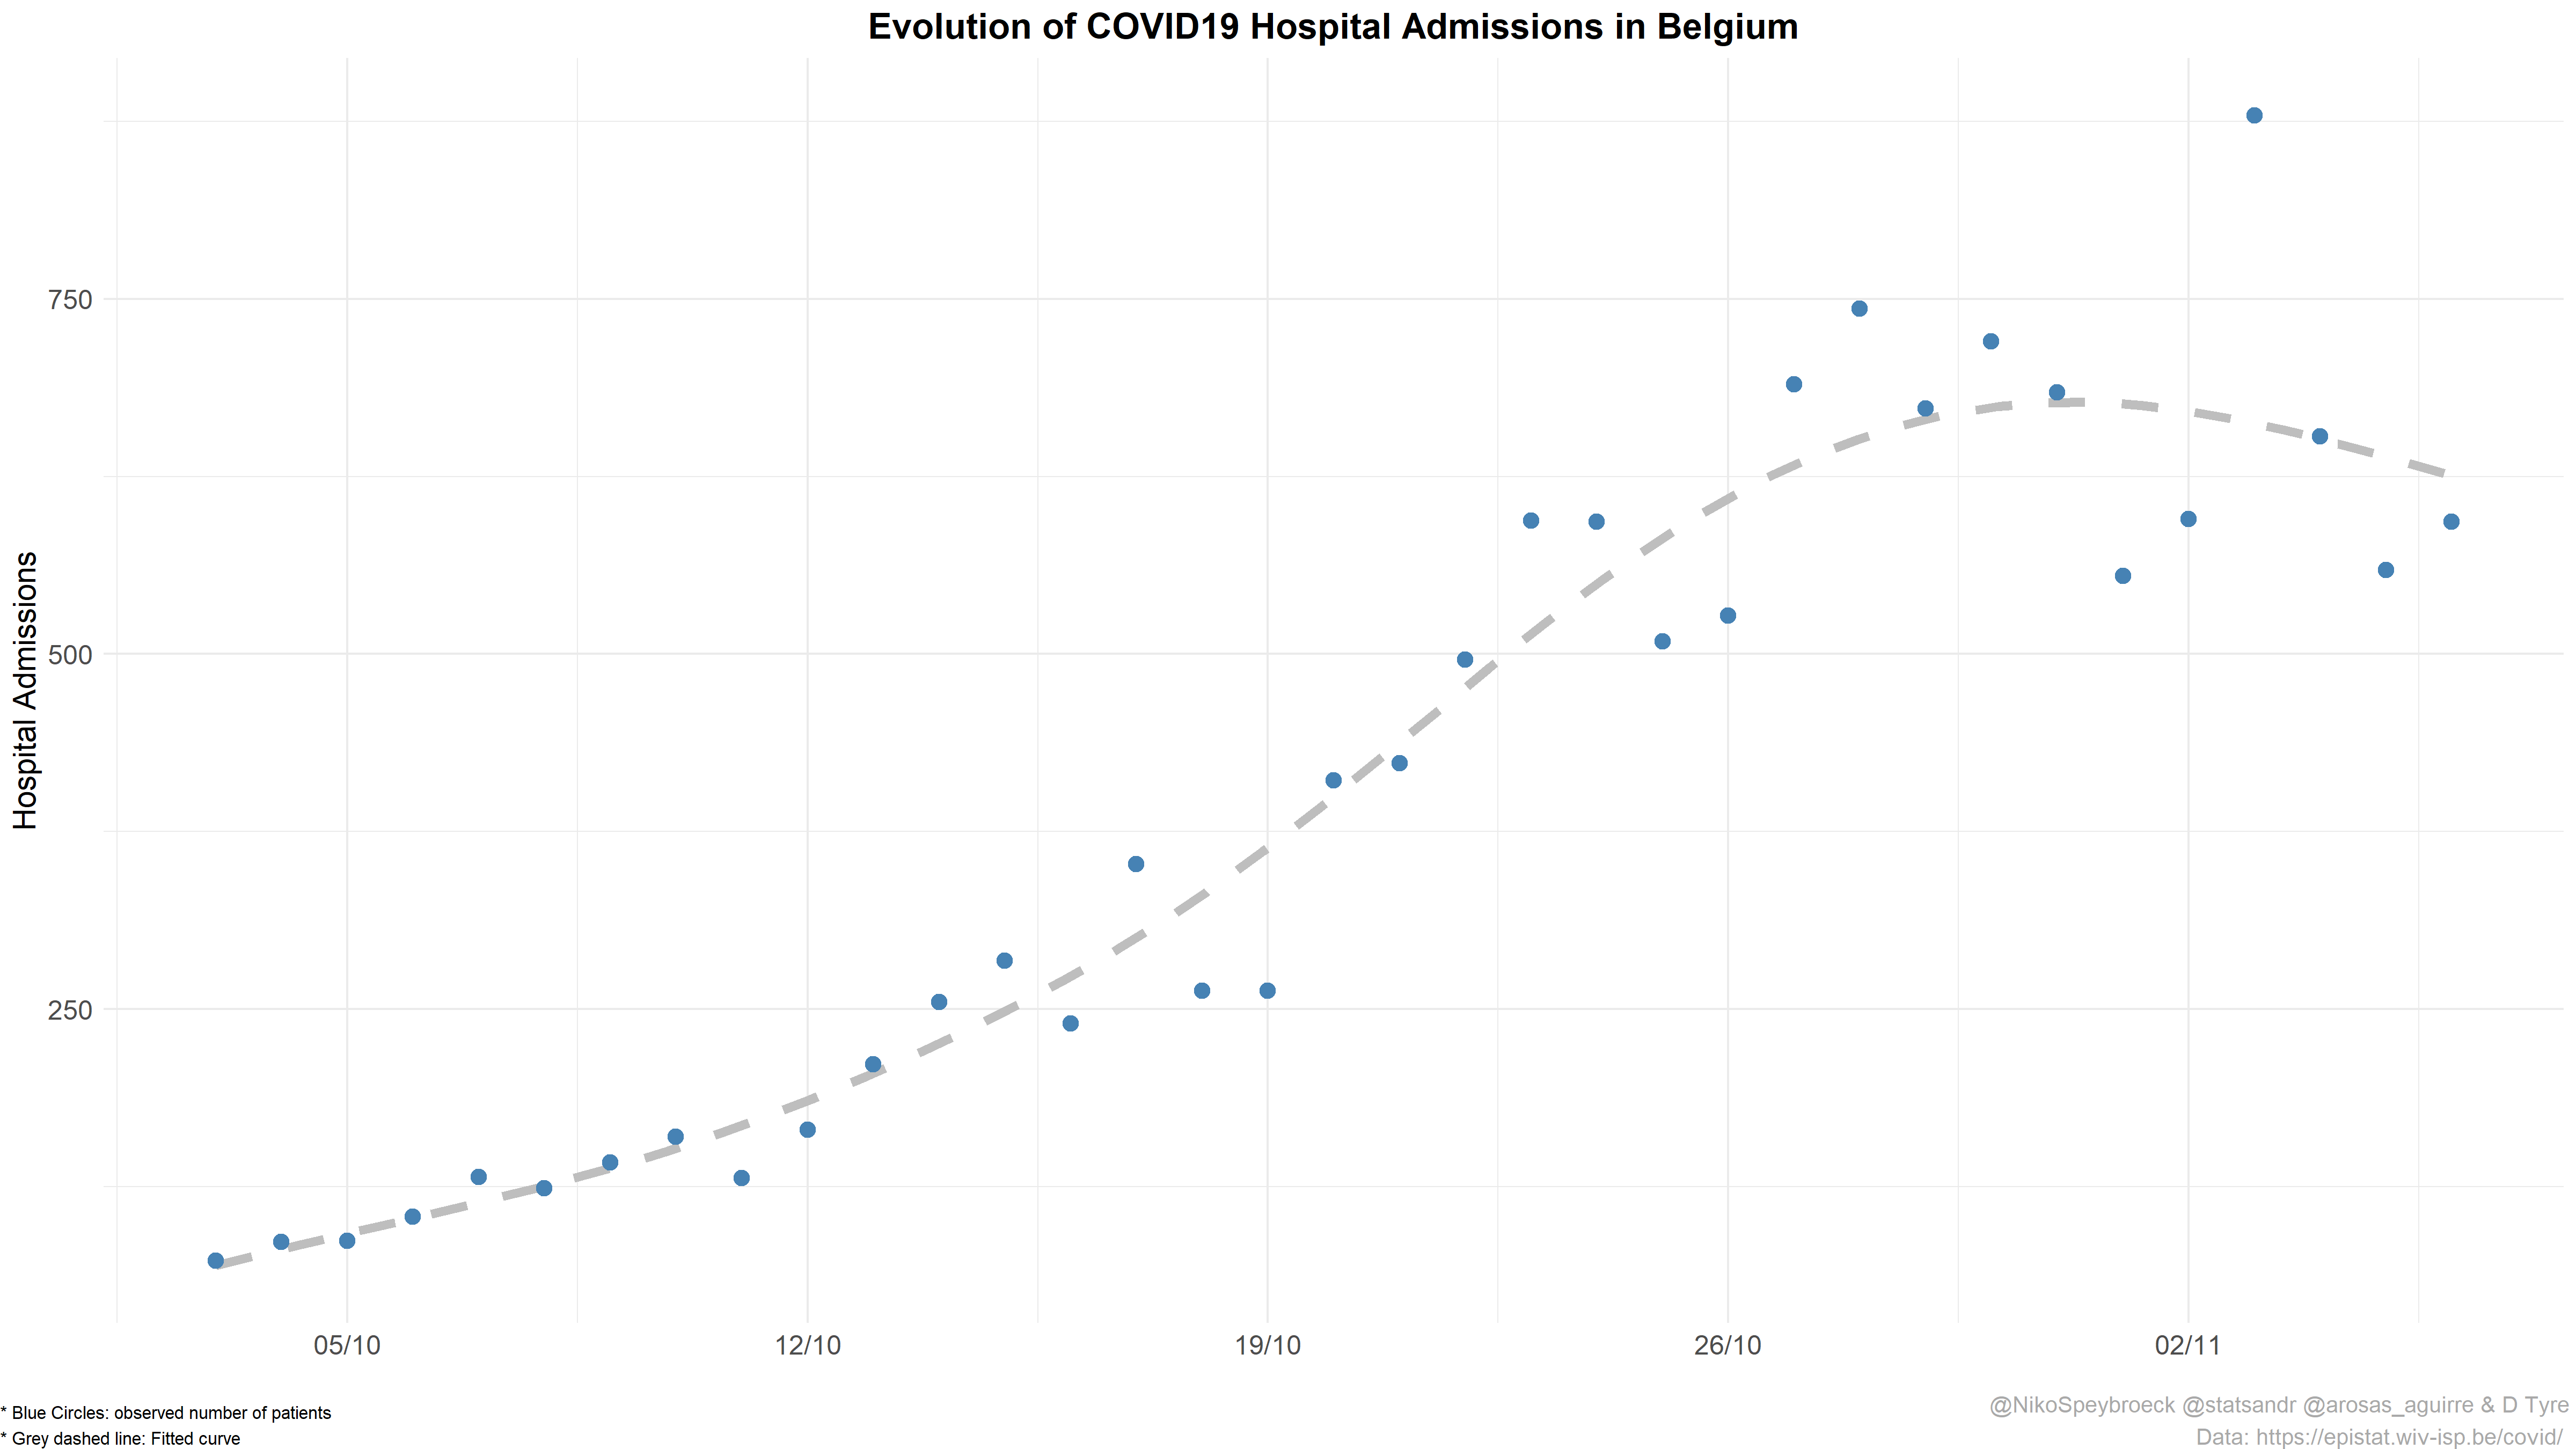
Observations are in line with other preliminary indications, such as trends of COVID19 hospitalizations (currently relatively volatile), indicating that transmission is slowing down:
Download the figure.
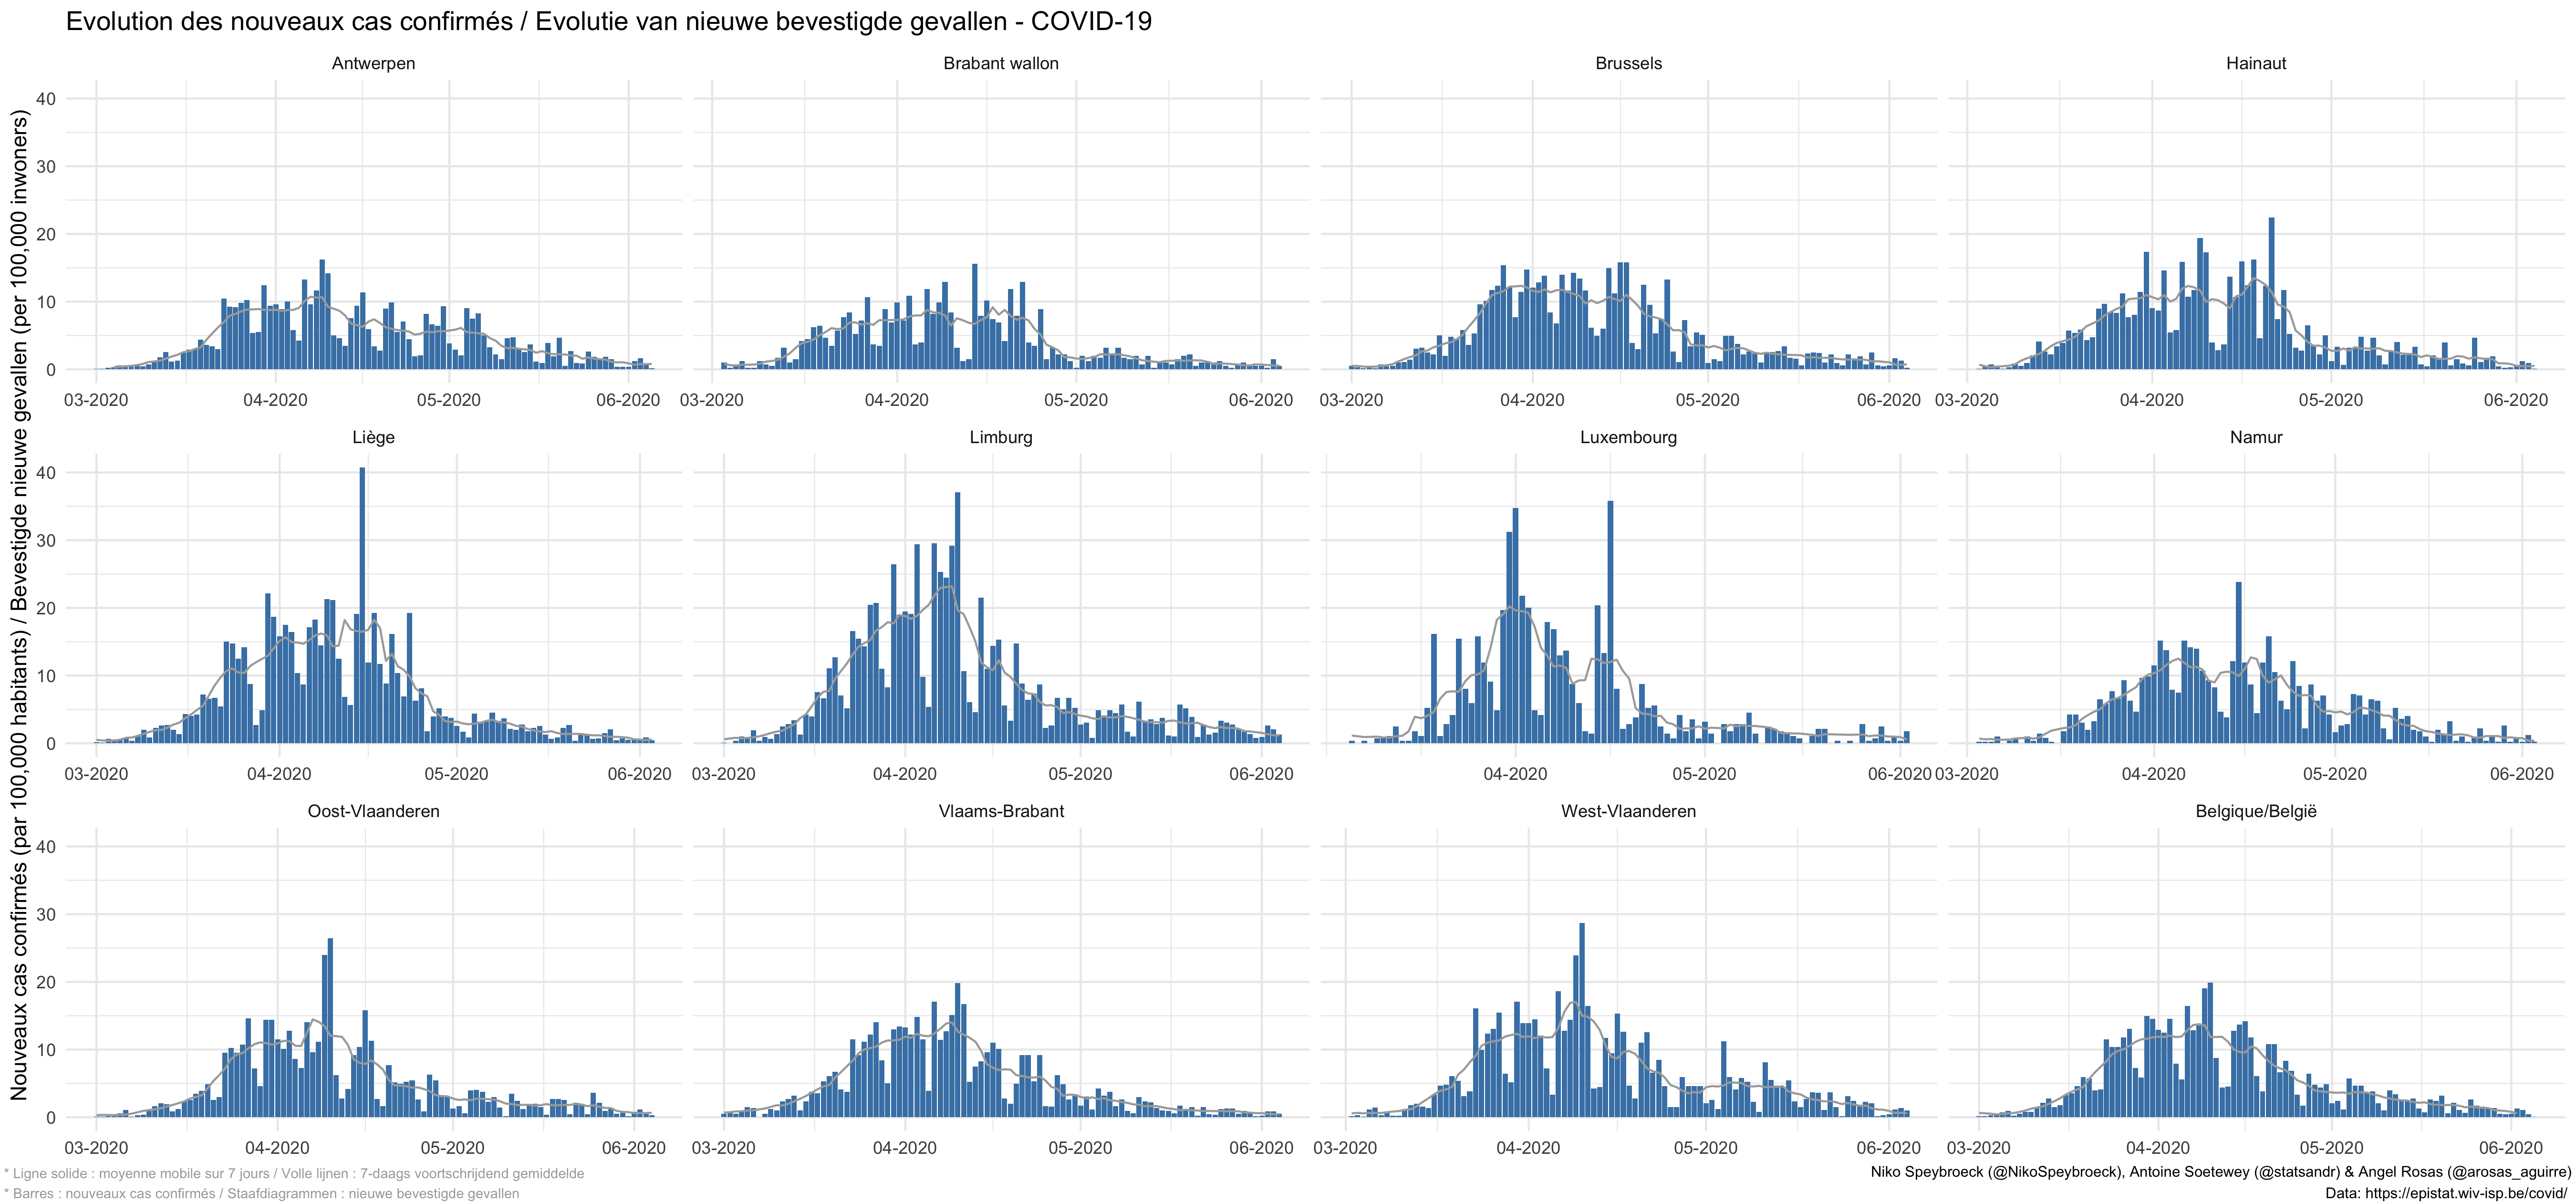
Confirmed cases
Note that the reported number of new confirmed cases is probably underestimated. This number does not take into account undiagnosed (without or with few symptoms) or untested cases. Therefore, figures with number of cases should be interpreted with extreme caution.
By age group and sex
Static
Below another visualization of the number of cases by age group and sex in Belgium, for three different periods:
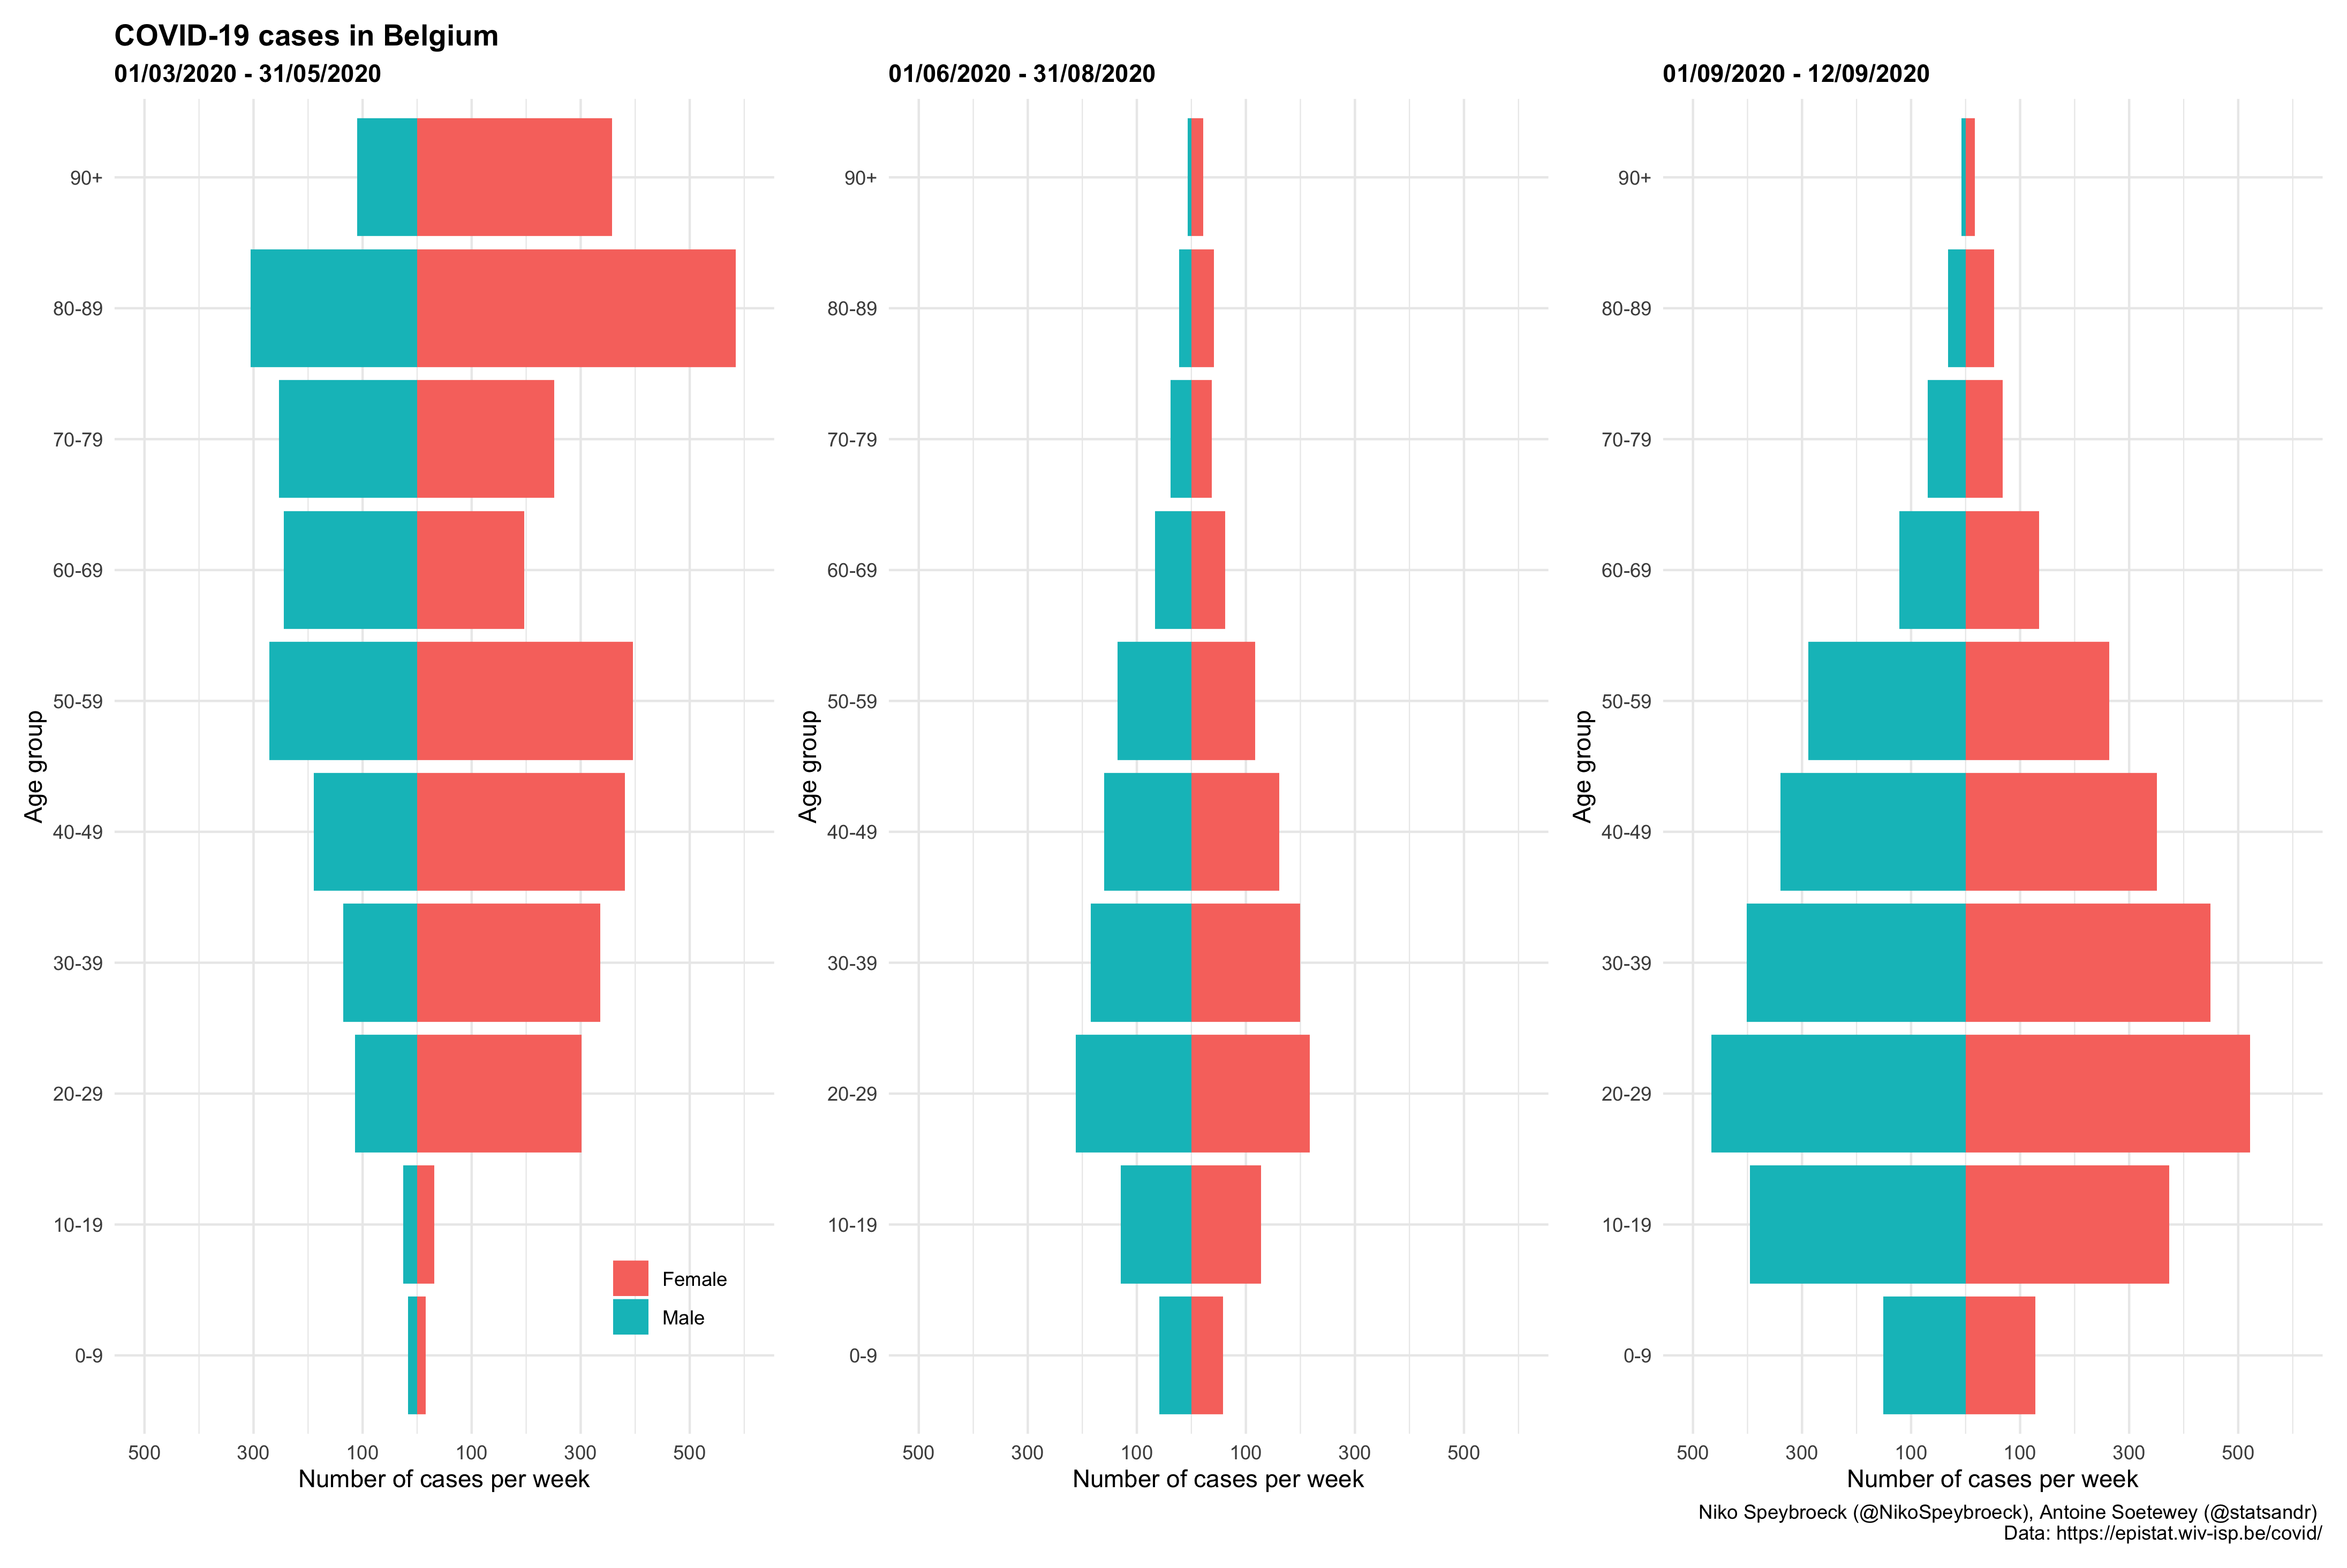
Download the figure or see the code.
This visualization shows the importance to report ages of cases and not just total number.
Moreover, we see that the distribution of cases per week by age group at the beginning of September is similar than during the summer holidays, but the number of cases per week is higher. The distribution of cases per week by age group at the beginning of September is however different from the “first wave” (period from March 1, 2020 to May 31, 2020). During the fist period, majority of cases were elderly, while at the beginning of September majority of cases are young people. It would be interesting to see how the distribution of cases by age group evolves during winter.
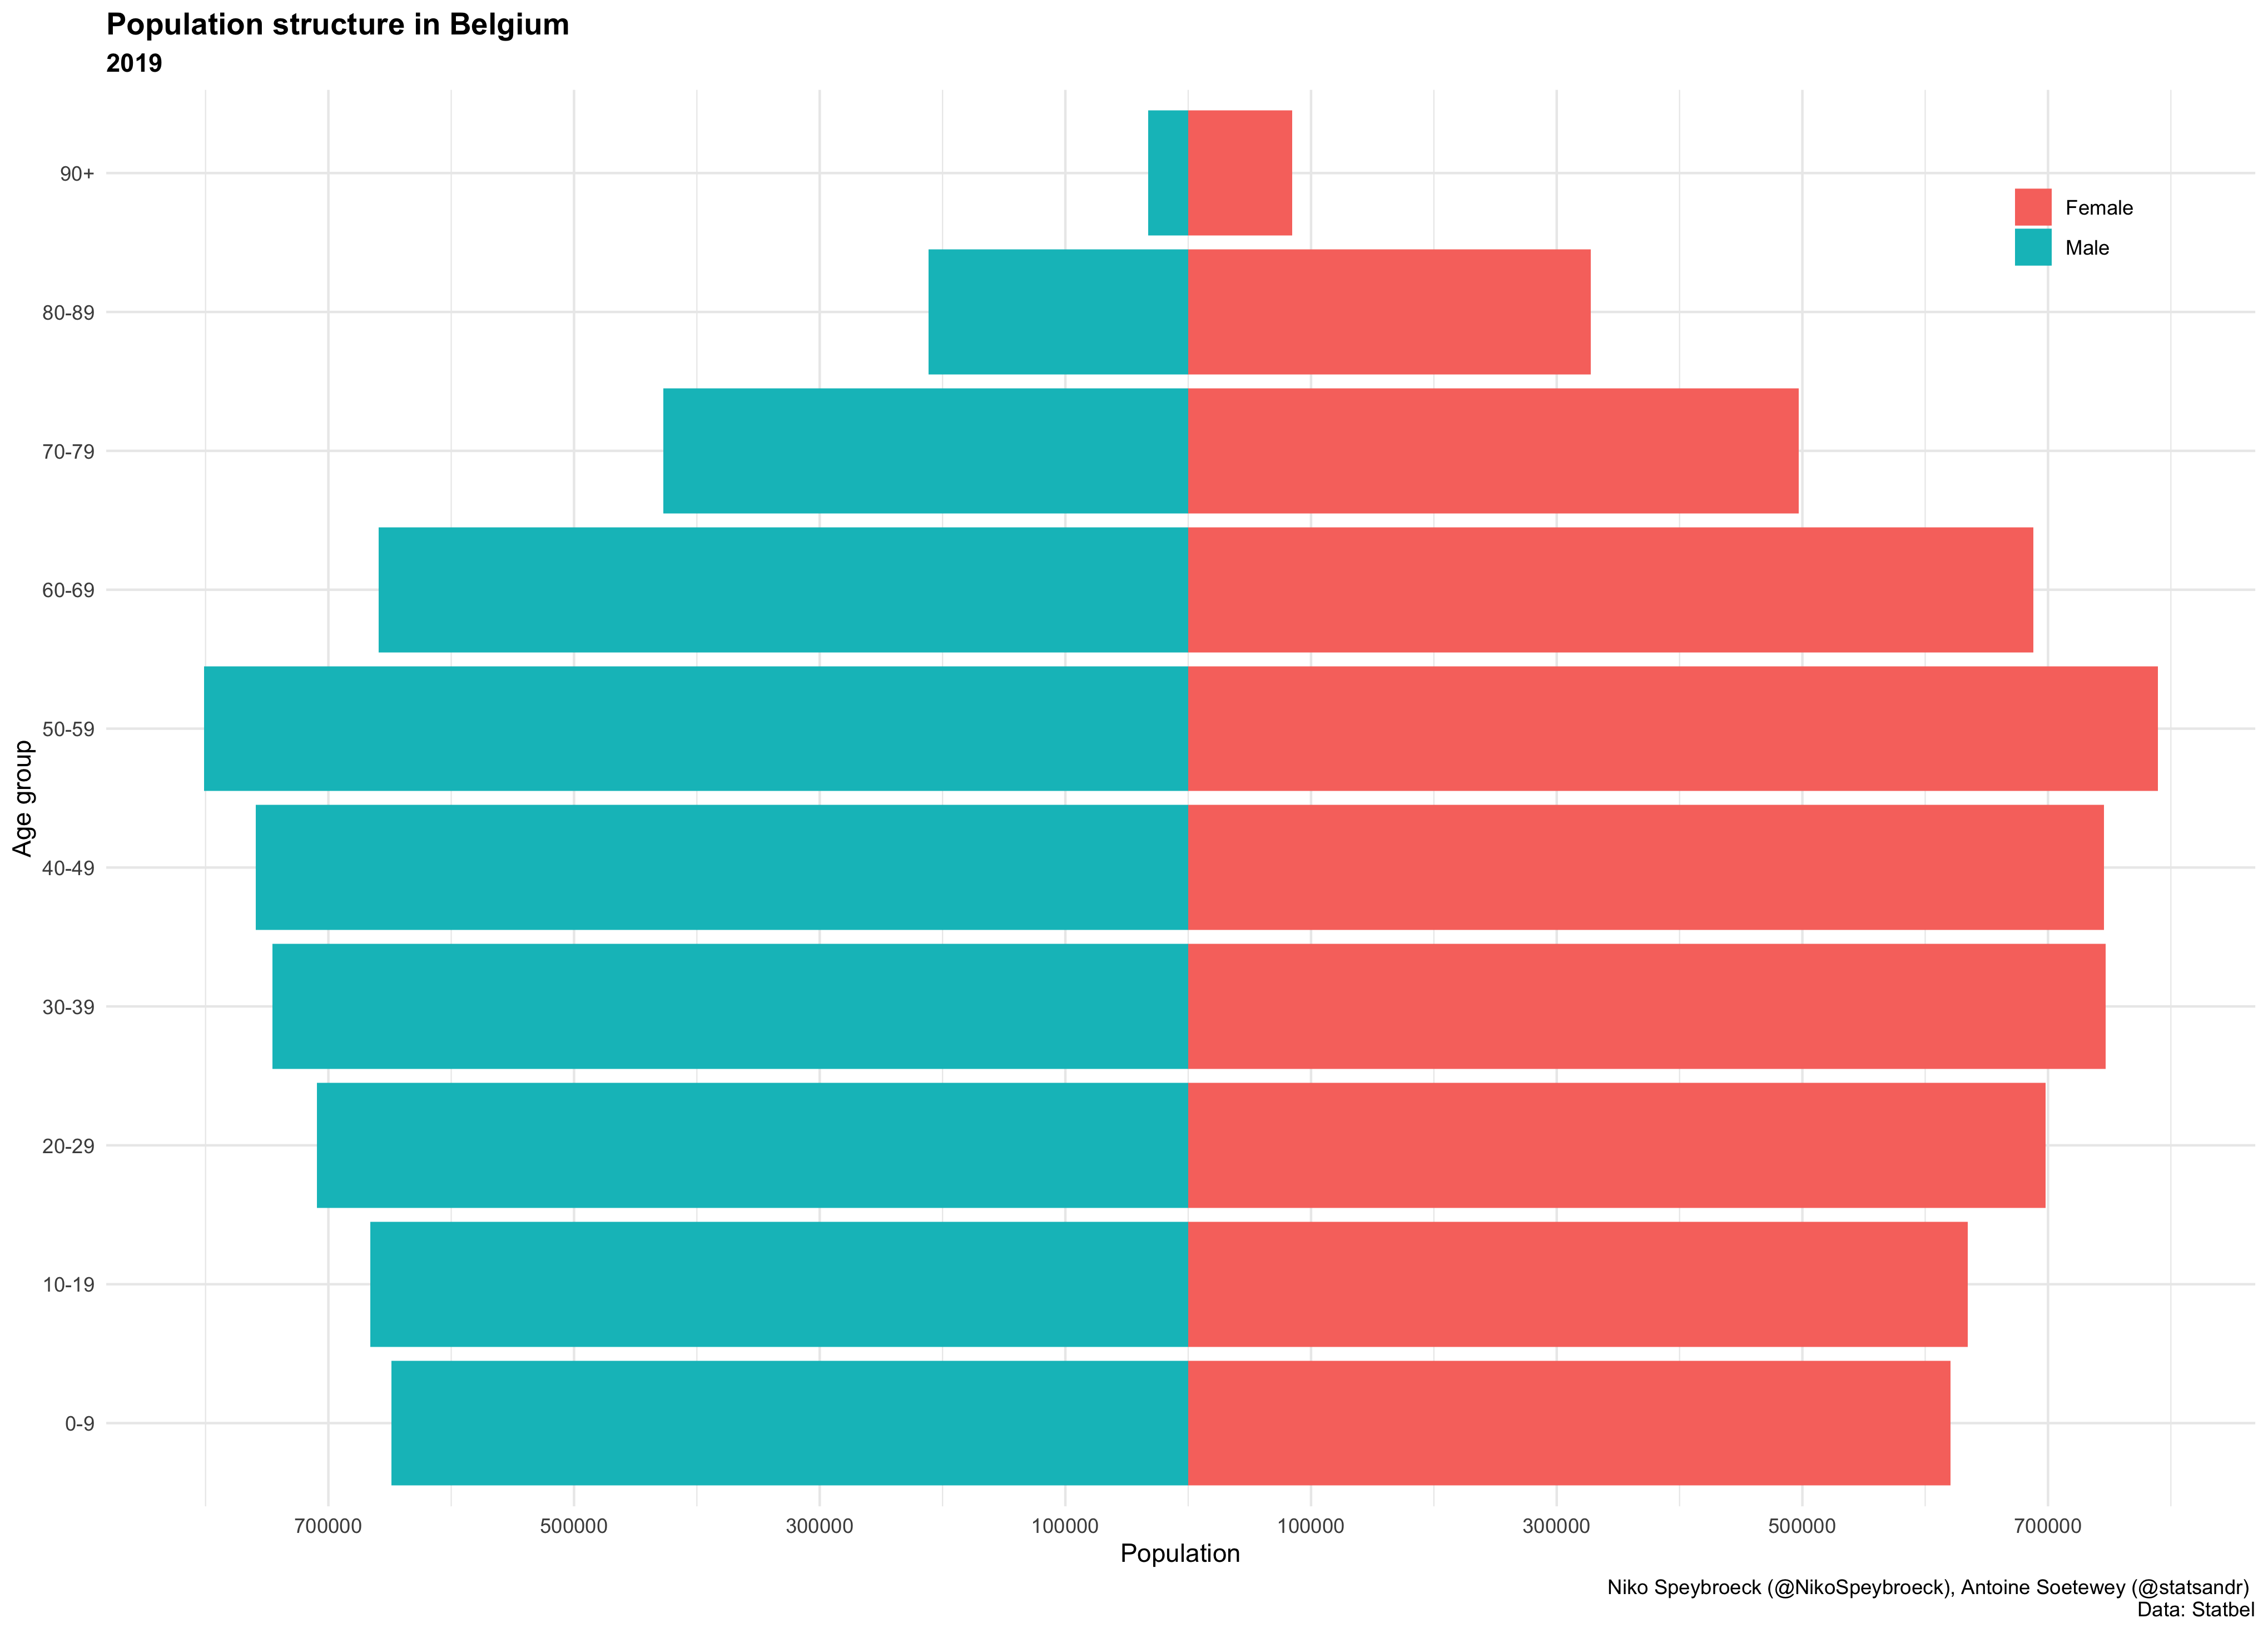
The figure above may be put in relation with the structure of the Belgian population:
Conclusion
Thanks for reading.
We hope that these figures will evolve in the right direction. In the meantime, take care and stay safe!
If you would like to be further updated on the evolution of the COVID-19 epidemic, two options:
- visit the blog from time to time, and
- join Twitter and follow us: statsandr, NikoSpeybroeck & arosas_aguirre
As always, if you have a question or a suggestion related to the topic covered in this article, please add it as a comment so other readers can benefit from the discussion.
Liked this post?
- Get updates every time a new article is published (no spam and unsubscribe anytime)
- Support the blog
- Share on:


