
How to create a simple Coronavirus dashboard specific to your country in R?
Coronavirus dashboard: the case of Belgium
Introduction
The Novel COVID-19 Coronavirus is the hottest topic right now. Every day, the media and newspapers share the number of new cases and deaths in several countries, try to measure the impacts of the virus on citizens and remind us to stay home in order to stay safe. The Coronavirus is on everyone’s lips.
In addition to governments, media and companies discussing about it, data scientists and data professionals in general are putting their knowledge and time at the service of the virus. This leads to a proliferation of applications, dashboards, blog posts, videos, datasets and code analyzing, in one way or another, the expansion of the COVID-19 and how it spreads in the population.
Coronavirus dashboard: the case of Belgium
Amongst all the visualizations I have seen so far, one is standing out by its simplicity and at the same time, by its completeness and by the quality of its visualizations. I thus decided to create a Coronavirus dashboard based on this already existing dashboard by Rami Krispin (which comes with a license that allows to be freely adapted and shared) and adapt it so that it is specific to Belgium. Note that I also removed some visualizations and tables from the initial dashboard to keep it really simple and straight to the point.
Before reading further, here is my Coronavirus dashboard adapted to Belgium and previews of the main sections below:
The dashboard is segmented into several sections that can be selected at the top:
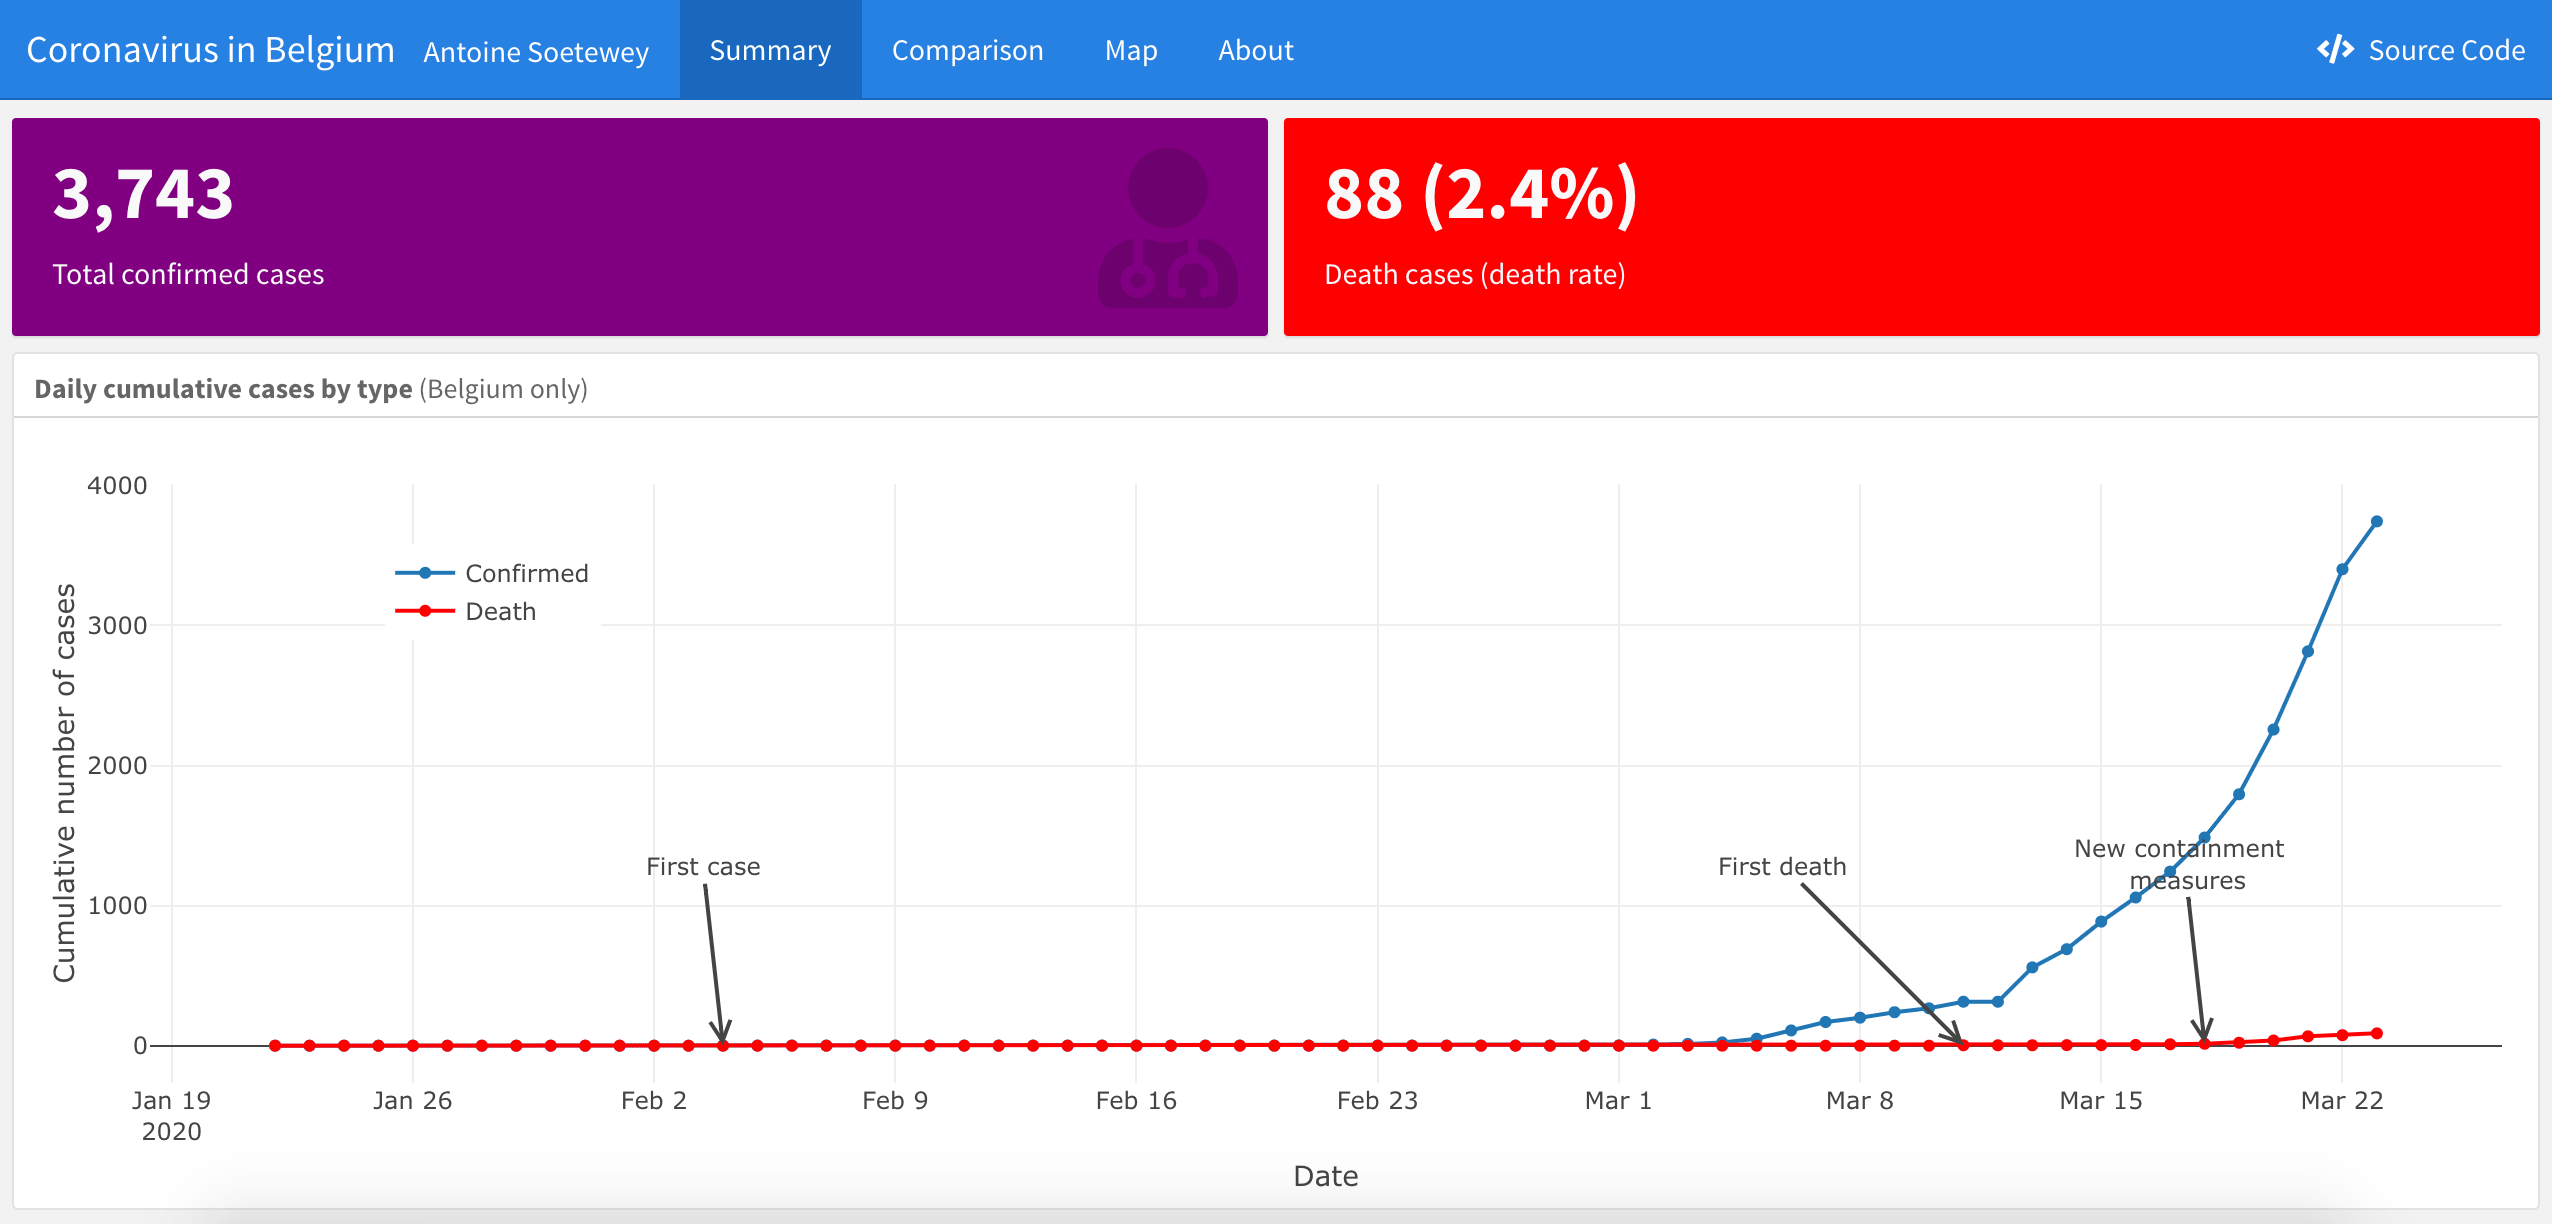
- The summary section provides key measures about the Coronavirus (total cases, active cases and deaths) and a plot displaying the cumulative number of active cases and deaths from January 22, 2020 to the latest available date.
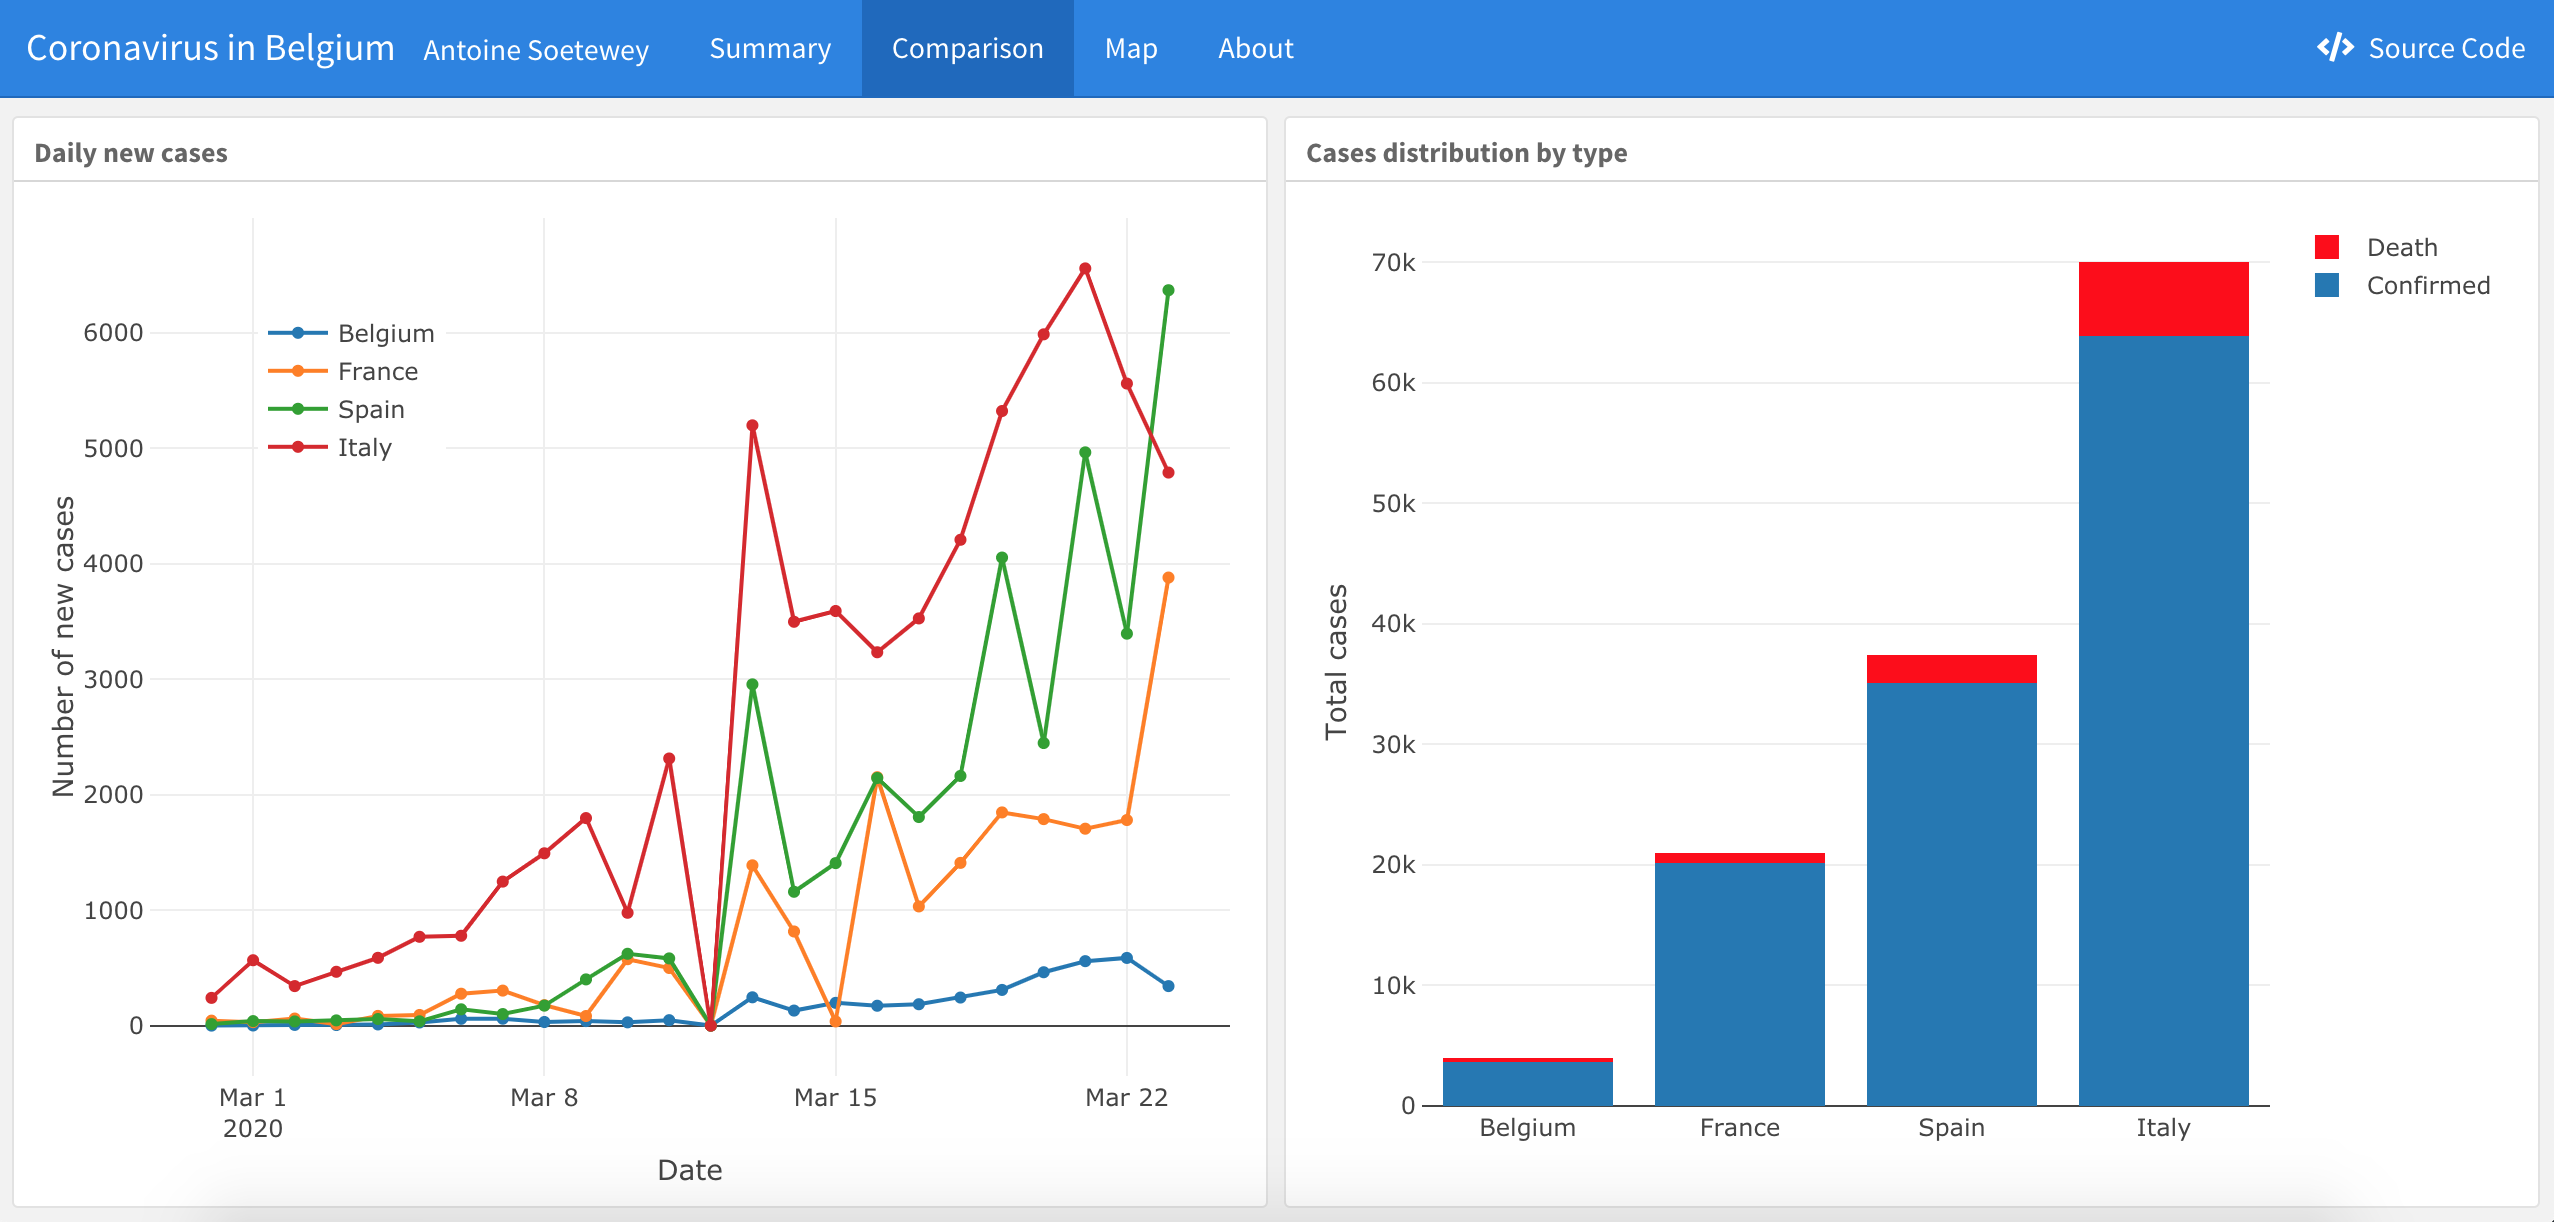
- The comparison section presents a comparison of the number of daily new cases (left panel) and the distribution of cases by type (right panel) with other European countries (you can also change these countries by replacing them in the code).
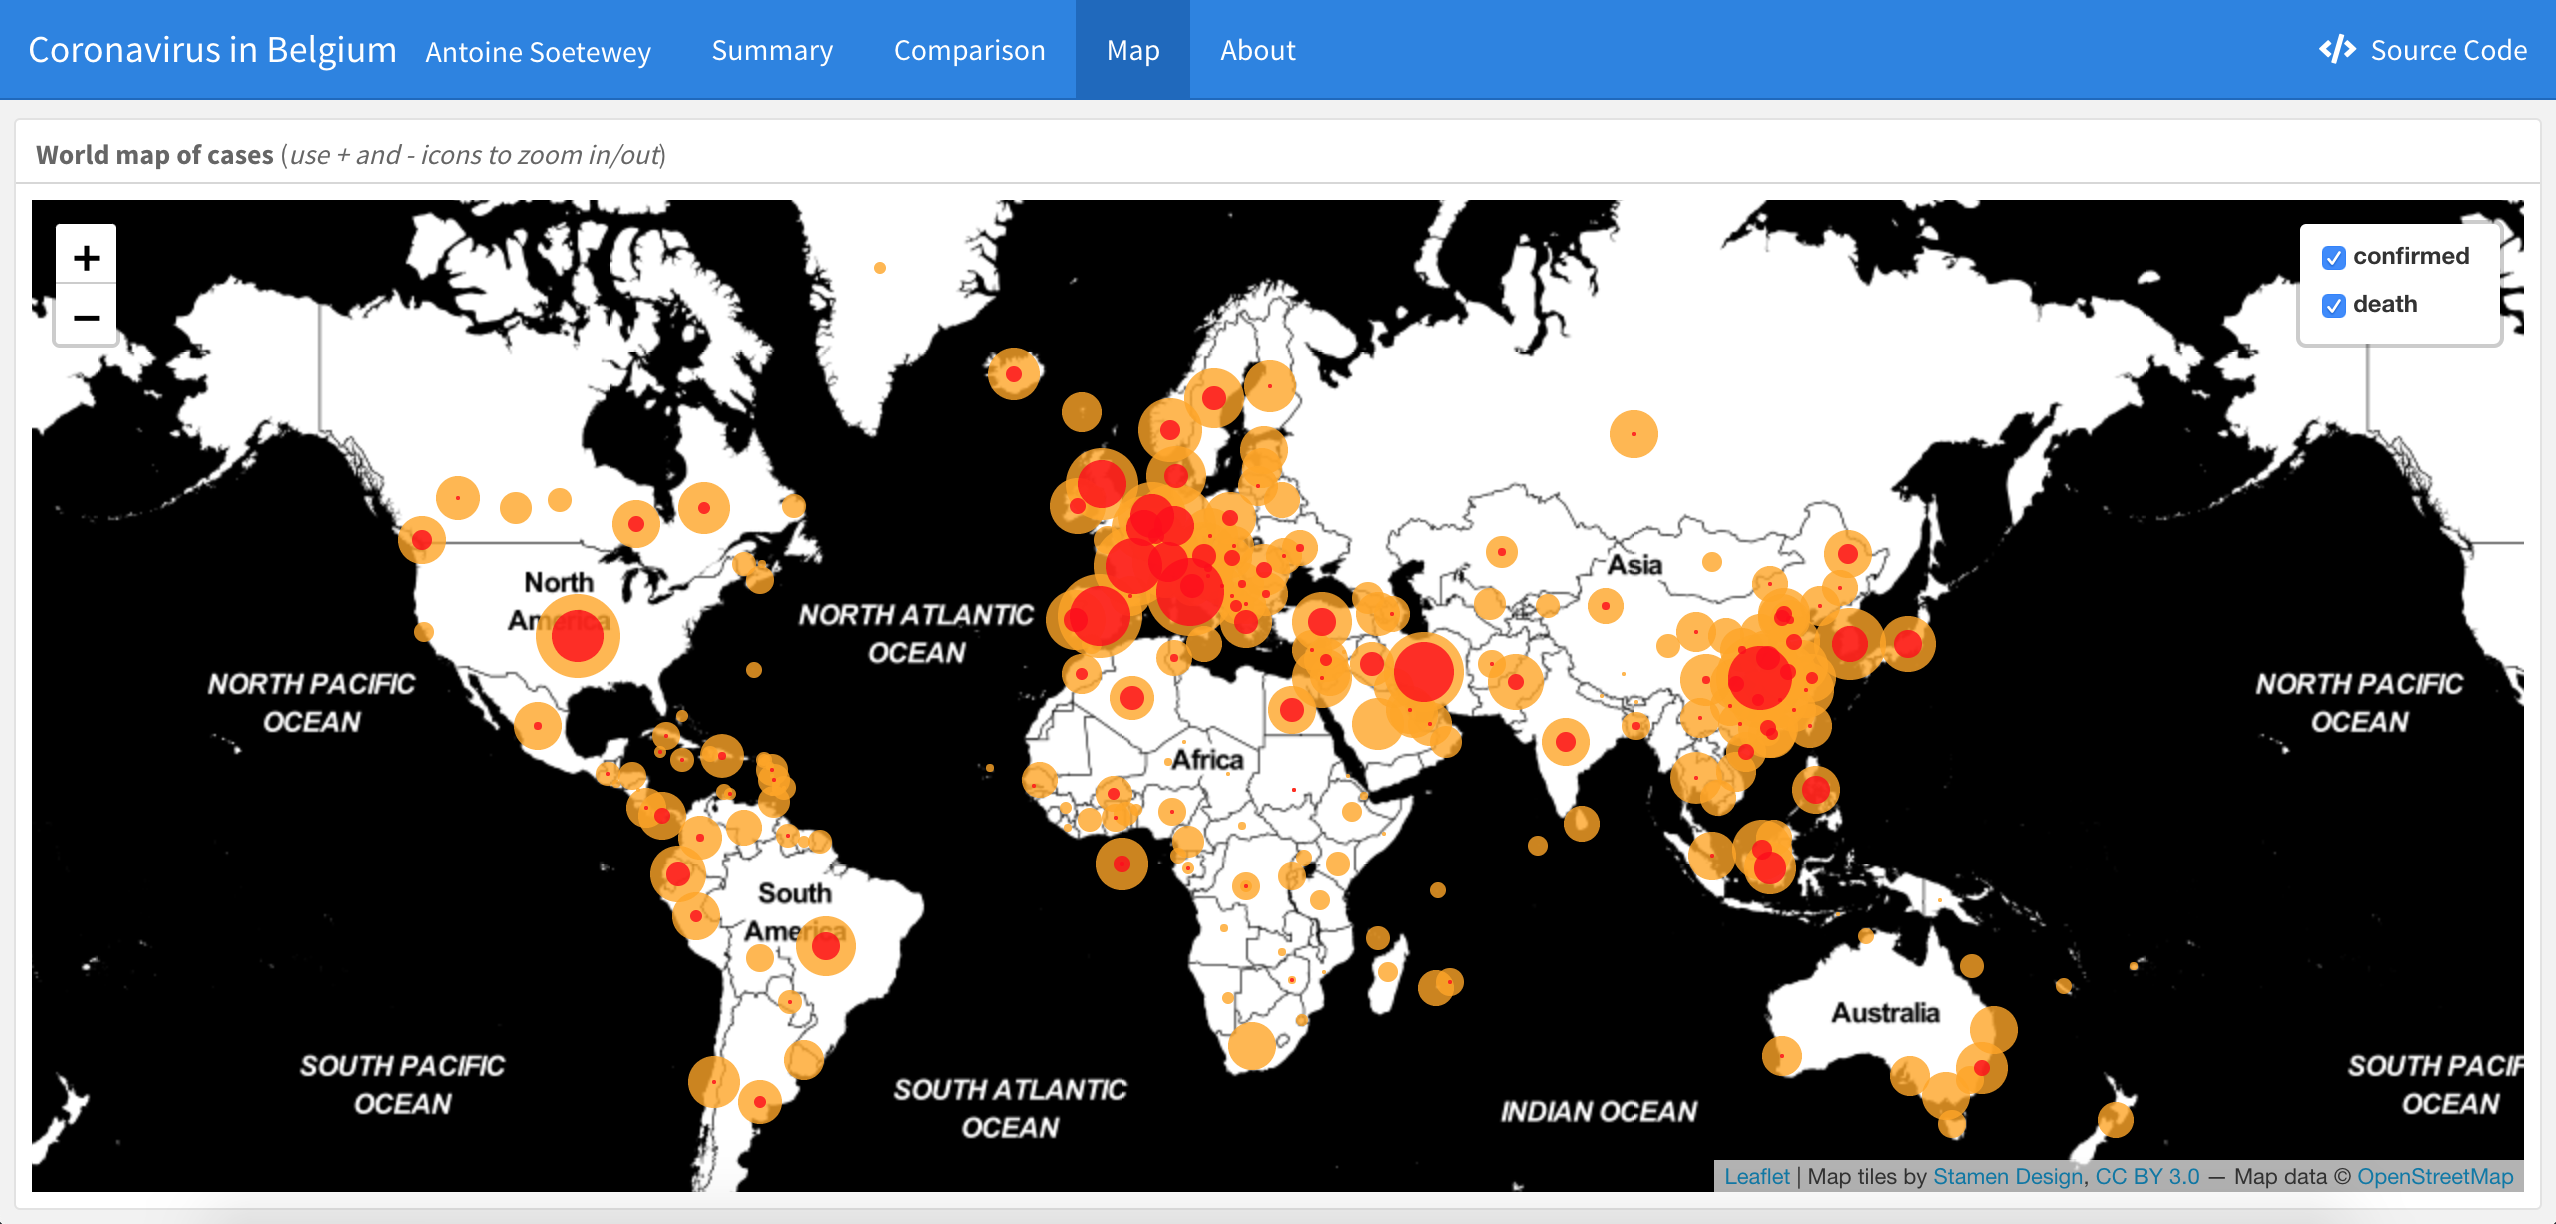
- The map section shows a world map of the confirmed cases and deaths. You can uncheck one or several types of cases (top right corner) and zoom in or out (top left corner) to adapt the map to your needs.
- The about section gives more information about the data, the dashboard in general and how often it is updated.
I believe this simple dashboard is easy enough to be adapted to any country (and by anyone from beginner to expert), and still communicate key measures about the virus throughout some visualizations.
A little extra which is worth mentioning is the fact that all plots are generated with the {plotly} package. This package allows to enhance plots by displaying additional relevant information when hovering over them (try by yourself!).
How to create your own Coronavirus dashboard
If you want to build your own dashboard specific to a country, follow these steps:
- Open the dashboard here
- See the entire code via the button “Source code” located in the top right corner of the dashboard, or see the code on GitHub. Copy that code.
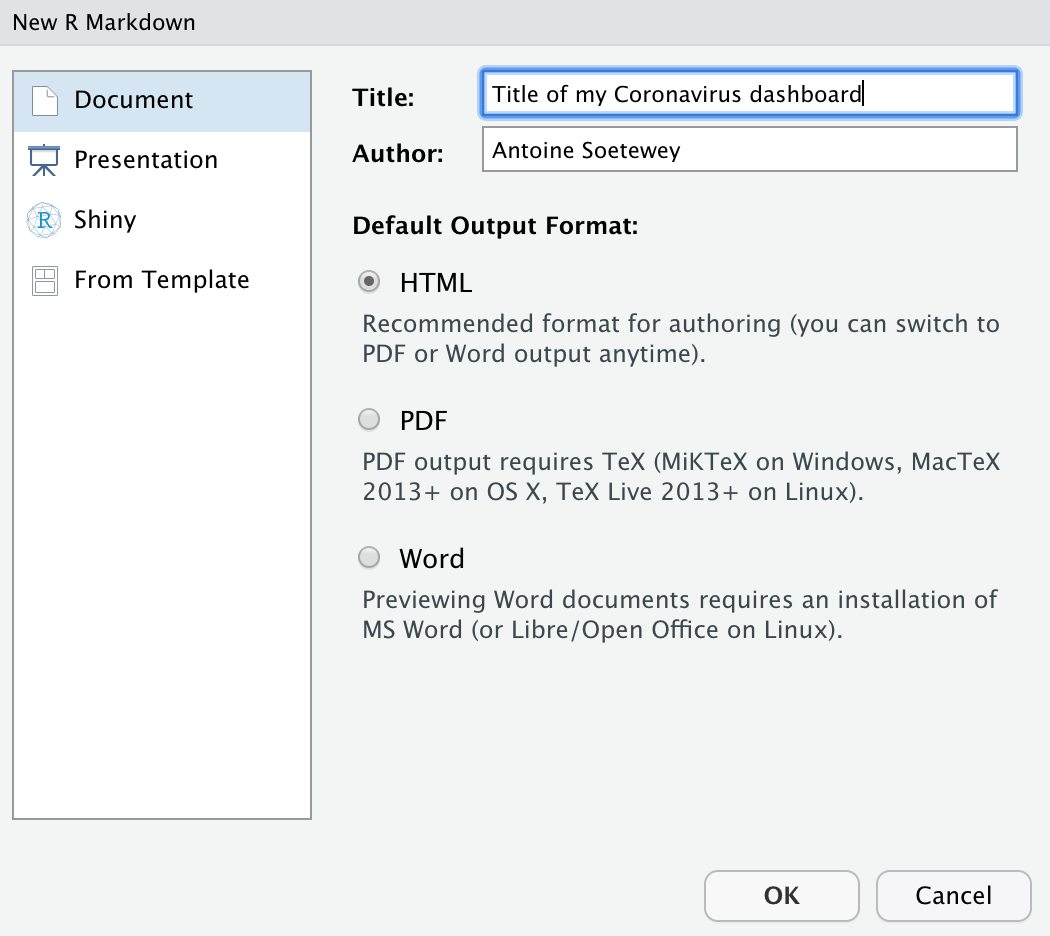
- Open a new R Markdown file (
.Rmd), type any title and author (they will be replaced in the next step anyway), select HTML as the output format and click on OK:
- Remove all the template code already present and paste the code you copied in step 1.
- Make sure that the required packages are installed:
install.packages(c("devtools", "flexdashboard", "leaflet", "leafpop"))
devtools::install_github("RamiKrispin/coronavirus", force = TRUE)
If R asks you which package you would like to update, there should be no need to update them: type 3 for “None”.
- In the code, replace
Belgiumwith your country. Here is the list of all available countries in the dataset:
Canada, United Kingdom, China, Netherlands, Australia, New Zealand, Denmark, France, Afghanistan, Albania, Algeria, Andorra, Angola, Antarctica, Antigua and Barbuda, Argentina, Armenia, Austria, Azerbaijan, Bahamas, Bahrain, Bangladesh, Barbados, Belarus, Belgium, Belize, Benin, Bhutan, Bolivia, Bosnia and Herzegovina, Botswana, Brazil, Brunei, Bulgaria, Burkina Faso, Burma, Burundi, Cabo Verde, Cambodia, Cameroon, Central African Republic, Chad, Chile, Colombia, Comoros, Congo (Brazzaville), Congo (Kinshasa), Costa Rica, Cote d’Ivoire, Croatia, Cuba, Cyprus, Czechia, Diamond Princess, Djibouti, Dominica, Dominican Republic, Ecuador, Egypt, El Salvador, Equatorial Guinea, Eritrea, Estonia, Eswatini, Ethiopia, Fiji, Finland, Gabon, Gambia, Georgia, Germany, Ghana, Greece, Grenada, Guatemala, Guinea, Guinea-Bissau, Guyana, Haiti, Holy See, Honduras, Hungary, Iceland, India, Indonesia, Iran, Iraq, Ireland, Israel, Italy, Jamaica, Japan, Jordan, Kazakhstan, Kenya, Kiribati, Korea, North, Korea, South, Kosovo, Kuwait, Kyrgyzstan, Laos, Latvia, Lebanon, Lesotho, Liberia, Libya, Liechtenstein, Lithuania, Luxembourg, Madagascar, Malawi, Malaysia, Maldives, Mali, Malta, Marshall Islands, Mauritania, Mauritius, Mexico, Micronesia, Moldova, Monaco, Mongolia, Montenegro, Morocco, Mozambique, MS Zaandam, Namibia, Nepal, Nicaragua, Niger, Nigeria, North Macedonia, Norway, Oman, Pakistan, Palau, Panama, Papua New Guinea, Paraguay, Peru, Philippines, Poland, Portugal, Qatar, Romania, Russia, Rwanda, Saint Kitts and Nevis, Saint Lucia, Saint Vincent and the Grenadines, Samoa, San Marino, Sao Tome and Principe, Saudi Arabia, Senegal, Serbia, Seychelles, Sierra Leone, Singapore, Slovakia, Slovenia, Solomon Islands, Somalia, South Africa, South Sudan, Spain, Sri Lanka, Sudan, Summer Olympics 2020, Suriname, Sweden, Switzerland, Syria, _Taiwan*_, Tajikistan, Tanzania, Thailand, Timor-Leste, Togo, Tonga, Trinidad and Tobago, Tunisia, Turkey, Uganda, Ukraine, United Arab Emirates, Uruguay, US, Uzbekistan, Vanuatu, Venezuela, Vietnam, West Bank and Gaza, Winter Olympics 2022, Yemen, Zambia and Zimbabwe
Note that if your country is spelled in two words or more, you will need to surround it by a backtick (but only at one specific line in the code, see an example with United Kingdom):
#----------------------------------------
# Plotting the data

daily_confirmed %>%
  plotly::plot_ly() %>%
  plotly::add_trace(
    x = ~date,
    y = ~`United Kingdom`,
    type = "scatter",
    mode = "lines+markers",
    name = "United Kingdom"
  ) %>%
Do not add backticks in the rest of the code as everywhere else the country’s name is surrounded by double quotes "".
Do not forget to also change the title and the author at the top of the document, and edit the about section at the bottom of the document. Last but not least, as you can see on the plot in the summary section, the arrows point to different (sad) “milestones” in Belgium (i.e., first case, first death and new containment measures).
You will need to adapt these milestones for your country (or remove them if you do not want to have any milestone displayed on the plot). Change this in the code following the plotly::add_annotations() functions.
- Knit the document (see this article if you are unfamiliar with R Markdown). Your dashboard should appear in HTML format.
Following these 7 steps, you should already have a simple dashboard specific to your country. I have intentionally kept it simple so that everyone could copy it and have their own dashboard in a limited amount of time.
If you are familiar with the {flexdashboard}, {plotly} and {leaflet} packages for the dashboard interface and the visualizations, and the {dplyr} and {tidyr} packages for the data manipulation, feel free to edit the code according to your needs and improve your dashboard.
Additional notes
Data
The input data for this dashboard is the dataset available from the {coronavirus} R package. Make sure to download the development version of the package to have the latest data:
install.packages("devtools")
devtools::install_github("RamiKrispin/coronavirus")
To update your dashboard with the latest data, you have to manually update the data by reinstalling the {coronavirus} package with devtools::install_github("RamiKrispin/coronavirus", force = TRUE). Again, if R asks you whether you would like to update other packages, type 3 for “None”.
This question was often raised so I repeat, your dashboard will not update by itself every day, you need to manually update it. After updating the data, you may also need to restart your R session in order to have the last available data.
The raw data is pulled from the Johns Hopkins University Center for Systems Science and Engineering (JHU CCSE) Coronavirus repository.
Open source
This dashboard and the code available on GitHub are open source so feel free to copy it, adapt it and share it as much as you want.
Accuracy
Please note that this dashboard has been built mainly for educational purposes. I update the dashboard as often as possible to keep it accurate. However, there is some uncertainty concerning the COVID-19 case numbers and the testing methods vary between countries so the figures on this dashboard may be slightly different compared to other sources. Currently, the maintainer of the dataset updates it on a daily basis, but updates may become less frequent in the future.
Publish your dashboard
If you want to share your dashboard, you can either:
- Upload it on your website if you have one (and I strongly suggest you to create one if you do not already have one)
- Publish it through RPubs (it is free and easy to publish your work directly from RStudio)
Conclusion
Thanks for reading.
I hope this article helped you to build your first Coronavirus dashboard in R. See these top R resources on Coronavirus if you need inspiration to enhance further your dashboard.
As always, if you have a question or a suggestion related to the topic covered in this article, please add it as a comment so other readers can benefit from the discussion.
I would be glad to mention a collection of Python resources if someone is willing to create a collection of resources about the Coronavirus made with this programming language. Feel free to contact me if this is the case.↩︎
Liked this post?
- Get updates every time a new article is published (no spam and unsubscribe anytime)
- Support the blog
- Share on:


